


At Sardine, we take stability very seriously. As we scale to more merchants and a variety of use cases, monitoring and alerting becomes even more critical. We use GCP for hosting, and while GCP offers some basic functionality, we decided to use datadog to uplevel our monitoring setup.
Benefit of using datadog includes:
- Ability to dynamically filter and group logs by custom label. You can sort of do this with GCP but not really.
- Setting warning and alert for the same monitor.
- Share monitor definition with different GCP projects (prod and staging) with different threshold.
- Sharing dashboard definition with different GCP projects.
- Overall cleaner, intuitive UI with fewer bugs.
Datadog provides an online guide for integrating with GCP. Because we use terraform for managing our infra, we wanted to setup everything using terraform.
Setup GCP integration from datadog
First step is select “integrations”>”Google Cloud Platform” from datadog and add your project. For this, you’ll need a service account with appropriate permission:
resource "google_service_account" "datadog-connect" { account_id = "datadog-connect" display_name = "Service Account for datadog connection"}resource "google_project_iam_member" "datadog-connect" { for_each = toset([ "roles/cloudasset.viewer", "roles/compute.viewer", "roles/monitoring.viewer", ]) role = each.key member = "serviceAccount:${google_service_account.datadog-connect.email}"}
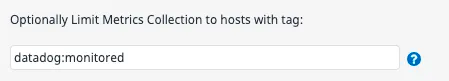
In addition, you can limit metrics collection to hosts with specific tags. Because in our development project our developer can create anything anytime, we set the specific label “datadog:monitored” to our monitoring targets hosts, and only collects metrics from these hosts
Additionally, it’s important to note that datadog connector doesn’t collect all metrics that GCP provides. For instance, we used to use p95 value of gcp.loadbalancing.https.backend_latencies metrics in our monitoring, but datadog can only collect avg and sumsqdev as of August 2021. We needed to define our own custom metrics at application level.
Log Collection
For applications running in GCE or GKE, the Datadog Agent can be used to collect logs locally. For other logs, you’ll need to forward log using log sink and pubsub.
resource "google_pubsub_topic" "export-logs-to-datadog" { name = "export-logs-to-datadog"}resource "google_pubsub_subscription" "datadog-logs" { name = "datadog-logs" topic = google_pubsub_topic.export-logs-to-datadog.name message_retention_duration = "604800s" retain_acked_messages = false ack_deadline_seconds = 60 push_config { push_endpoint = "https://gcp-intake.logs.datadoghq.com/v1/input/${var.datadog_key}/" }}resource "google_logging_project_sink" "datadog-sink" { name = "datadog-sink" destination = "pubsub.googleapis.com/${google_pubsub_topic.export-logs-to-datadog.id}" filter = "" unique_writer_identity = true}resource "google_project_iam_member" "pubsub-publisher-permisson" { role = "roles/pubsub.publisher" member = google_logging_project_sink.datadog-sink.writer_identity}
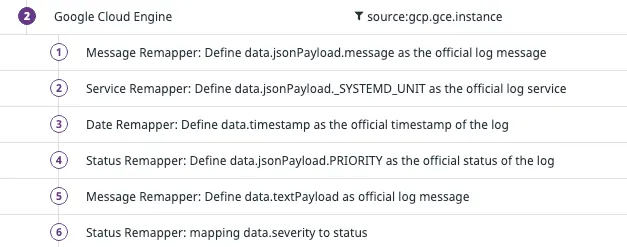
You may need to define custom log pipeline so your log structure is properly reflected in datadog logs UI. Here is our pipeline.
Custom metrics (datadog agent)
To collect additional metrics, logs and custom metrics, you’ll need to install datadog agent. Agent is offered as Docker image as well as packages for most of OSs so it’s typically very easy to install.
One complication for us was that we were not using GKE (yet). We were using managed instance group with container-optimized OS. Since we use golang for most of our application, our application Docker image is pretty simple — we simply copy golang application on scratch image. This means there is no OS to install datadog package, so we needed to figure out a way to run two Docker images (our application image and datadog agent image) on the container-optimized OS.
While it’s not well documented, it turns out that you can start a Docker in startup_script of the VM.
module "managed_instance_group_template" { source = "terraform-google-modules/vm/google//modules/instance_template" ...startup_script = "docker run -d --name dd-agent ...."
That’s it! While we’re in the middle of the setup, we’re already seeing value from datadog and very happy with it!