


Sardine provides a platform offering risk, compliance, and payment protection solutions, helping businesses increase customer trust and loyalty. A crucial aspect of our platform involves understanding complex relationships within customer data.
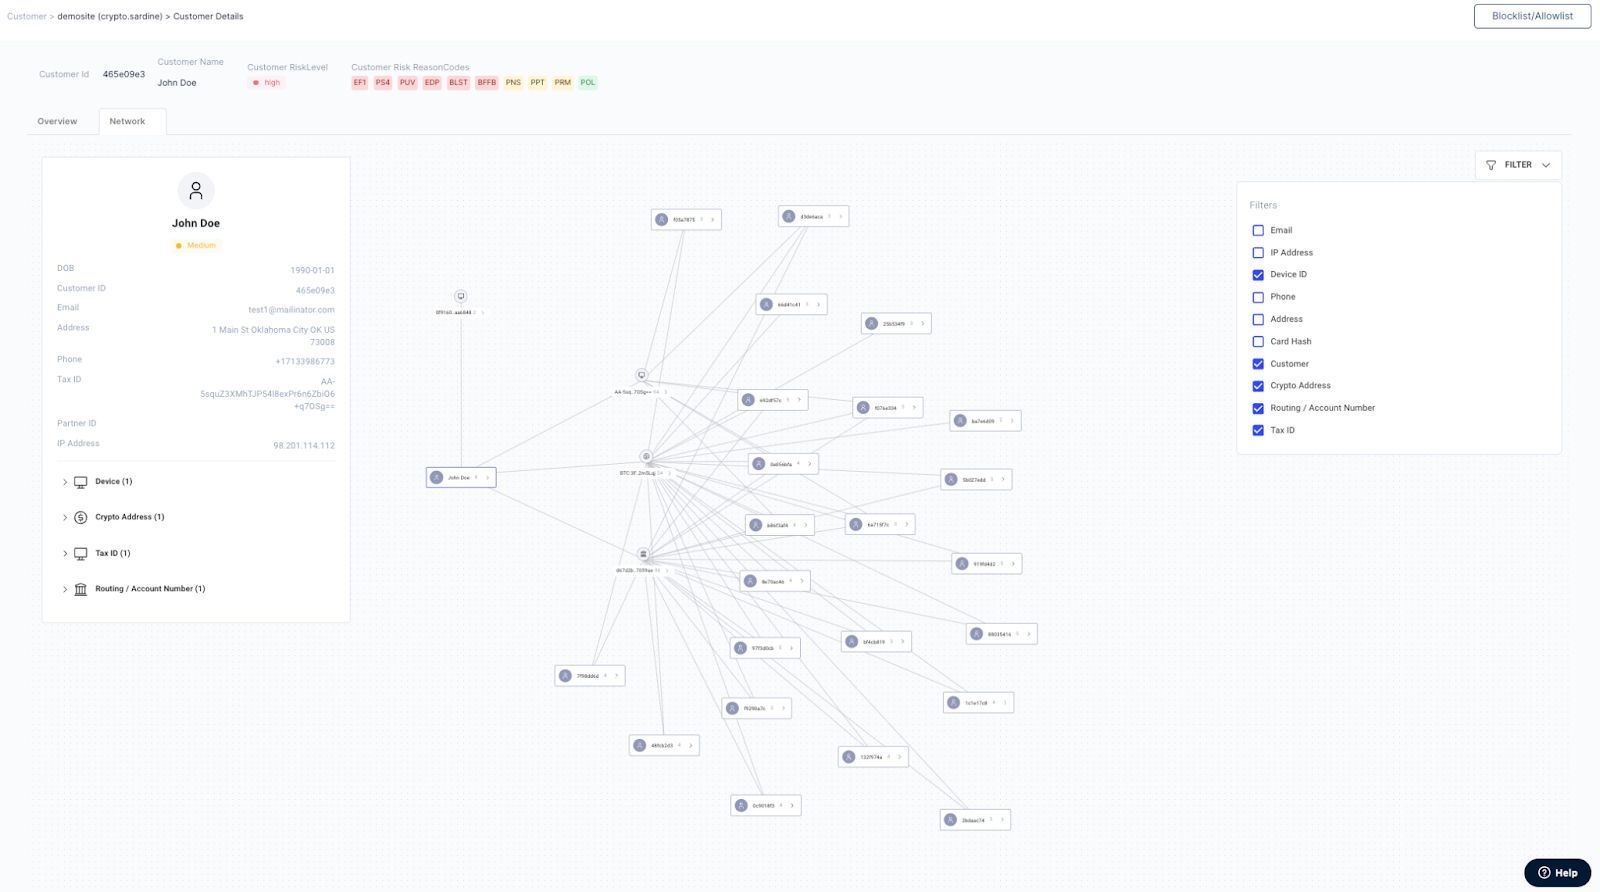
In this blog post, I'll demonstrate the process of building a powerful network visualization tool using React Flow, a flexible and easy-to-use library for rendering interactive graphs in React applications. This customer network graph will help visualize connections between various entities, such as clients, customers, devices, and contact information, providing invaluable insights for data-driven decision-making processes. Users can cluster accounts, identify flow of funds and flag activities for follow up in the Sardine case management system.
Creating Custom Nodes and Fetching Graph Data
For our Customer Network Graph, we need several custom node types to represent different entities. To create a custom node, let me first define functional components, then style it using CSS. Here's an example of simple custom nodes representing an email address, phone number, and device:
and we define node types constant and pass it to ReactFlow later so ReactFlow recognizes custom node different designs.
Processing Graph Data and Calculating Node Positions
To process the raw graph data and transform it into a format that React Flow can understand, we'll perform several operations, such as:
- Converting the raw graph nodes and edges into ReactFlowNode and ReactFlowEdge types.
- Generating ElkNode and ElkEdge to calculate node positions using ELK.
- Filtering and displaying the nodes and edges based on user-defined criteria.
You can explore the ELK algorithms here.
Rendering the Graph and Handling User Interactions
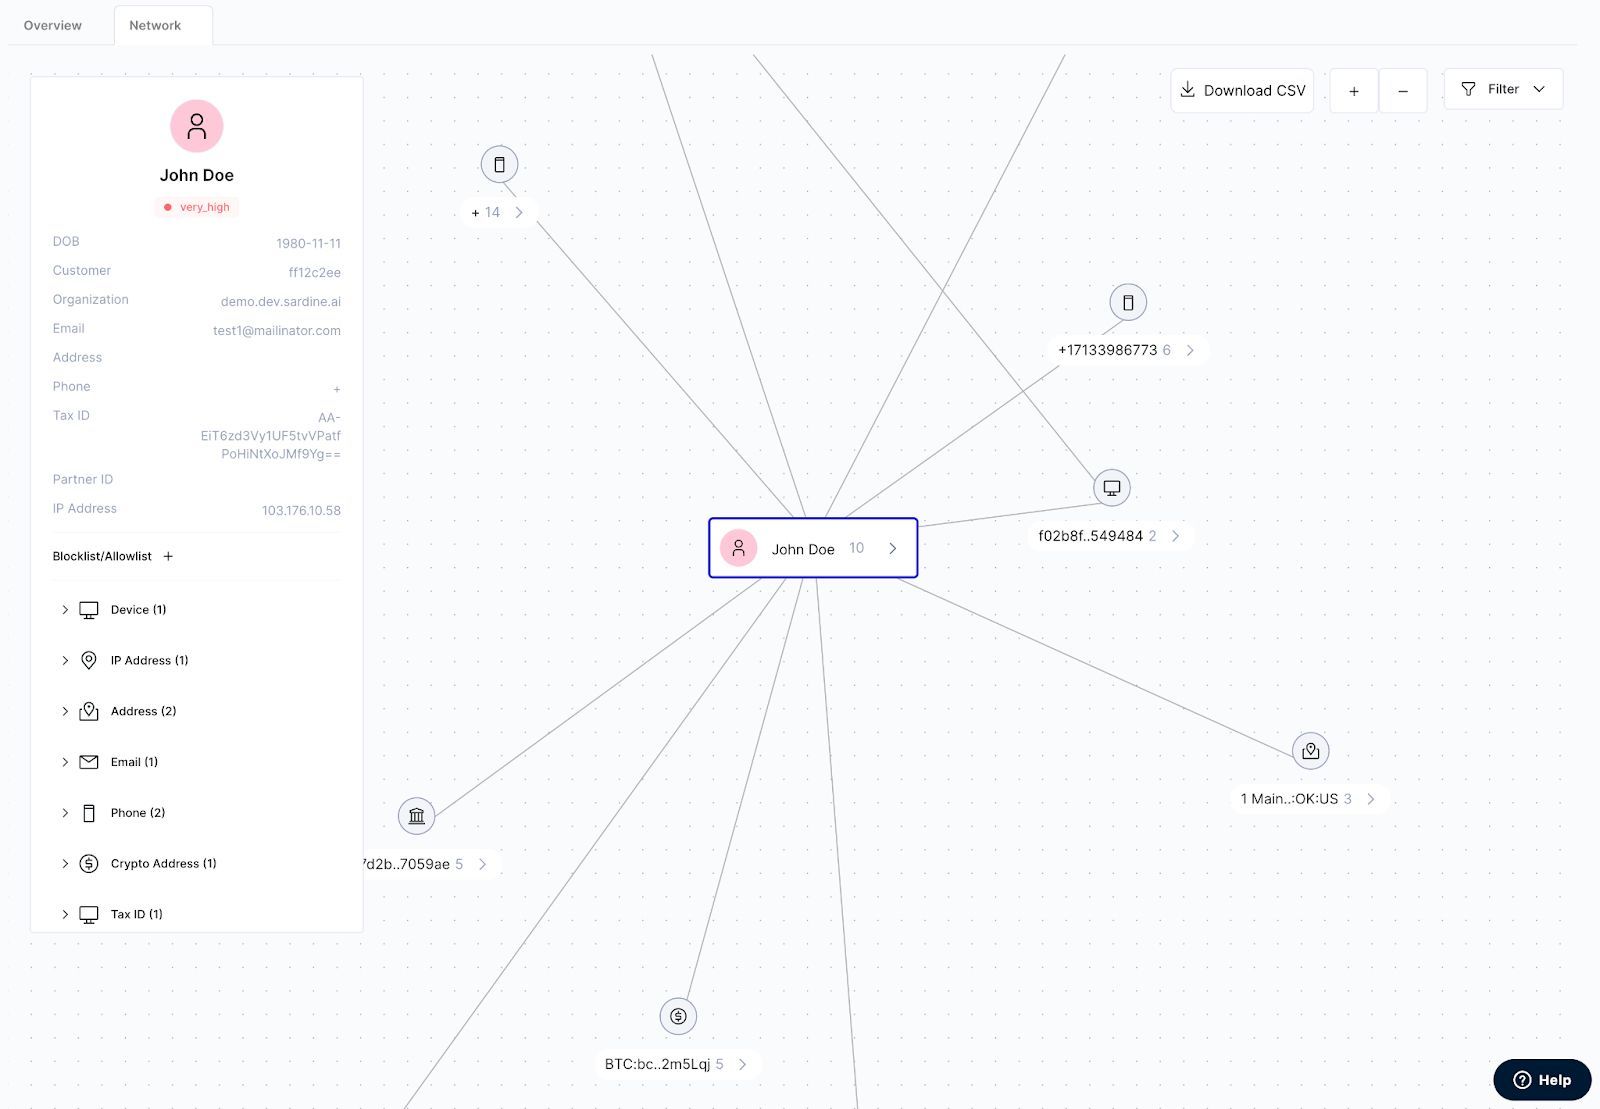
Now that we have the processed graph data and the calculated node positions, we can render the graph using React Flow. We'll also handle user interactions like node and edge selection, zooming, panning, and context menus.
With this implementation, you'll have a powerful and interactive network visualization tool that can display a Network Graph. You can further customize the tool to meet your specific needs and requirements. Extending the Graph's Functionality To improve the user experience and add more functionality to your network visualization tool, you can extend it by implementing features such as filtering, context menus, and tooltips.
Filtering
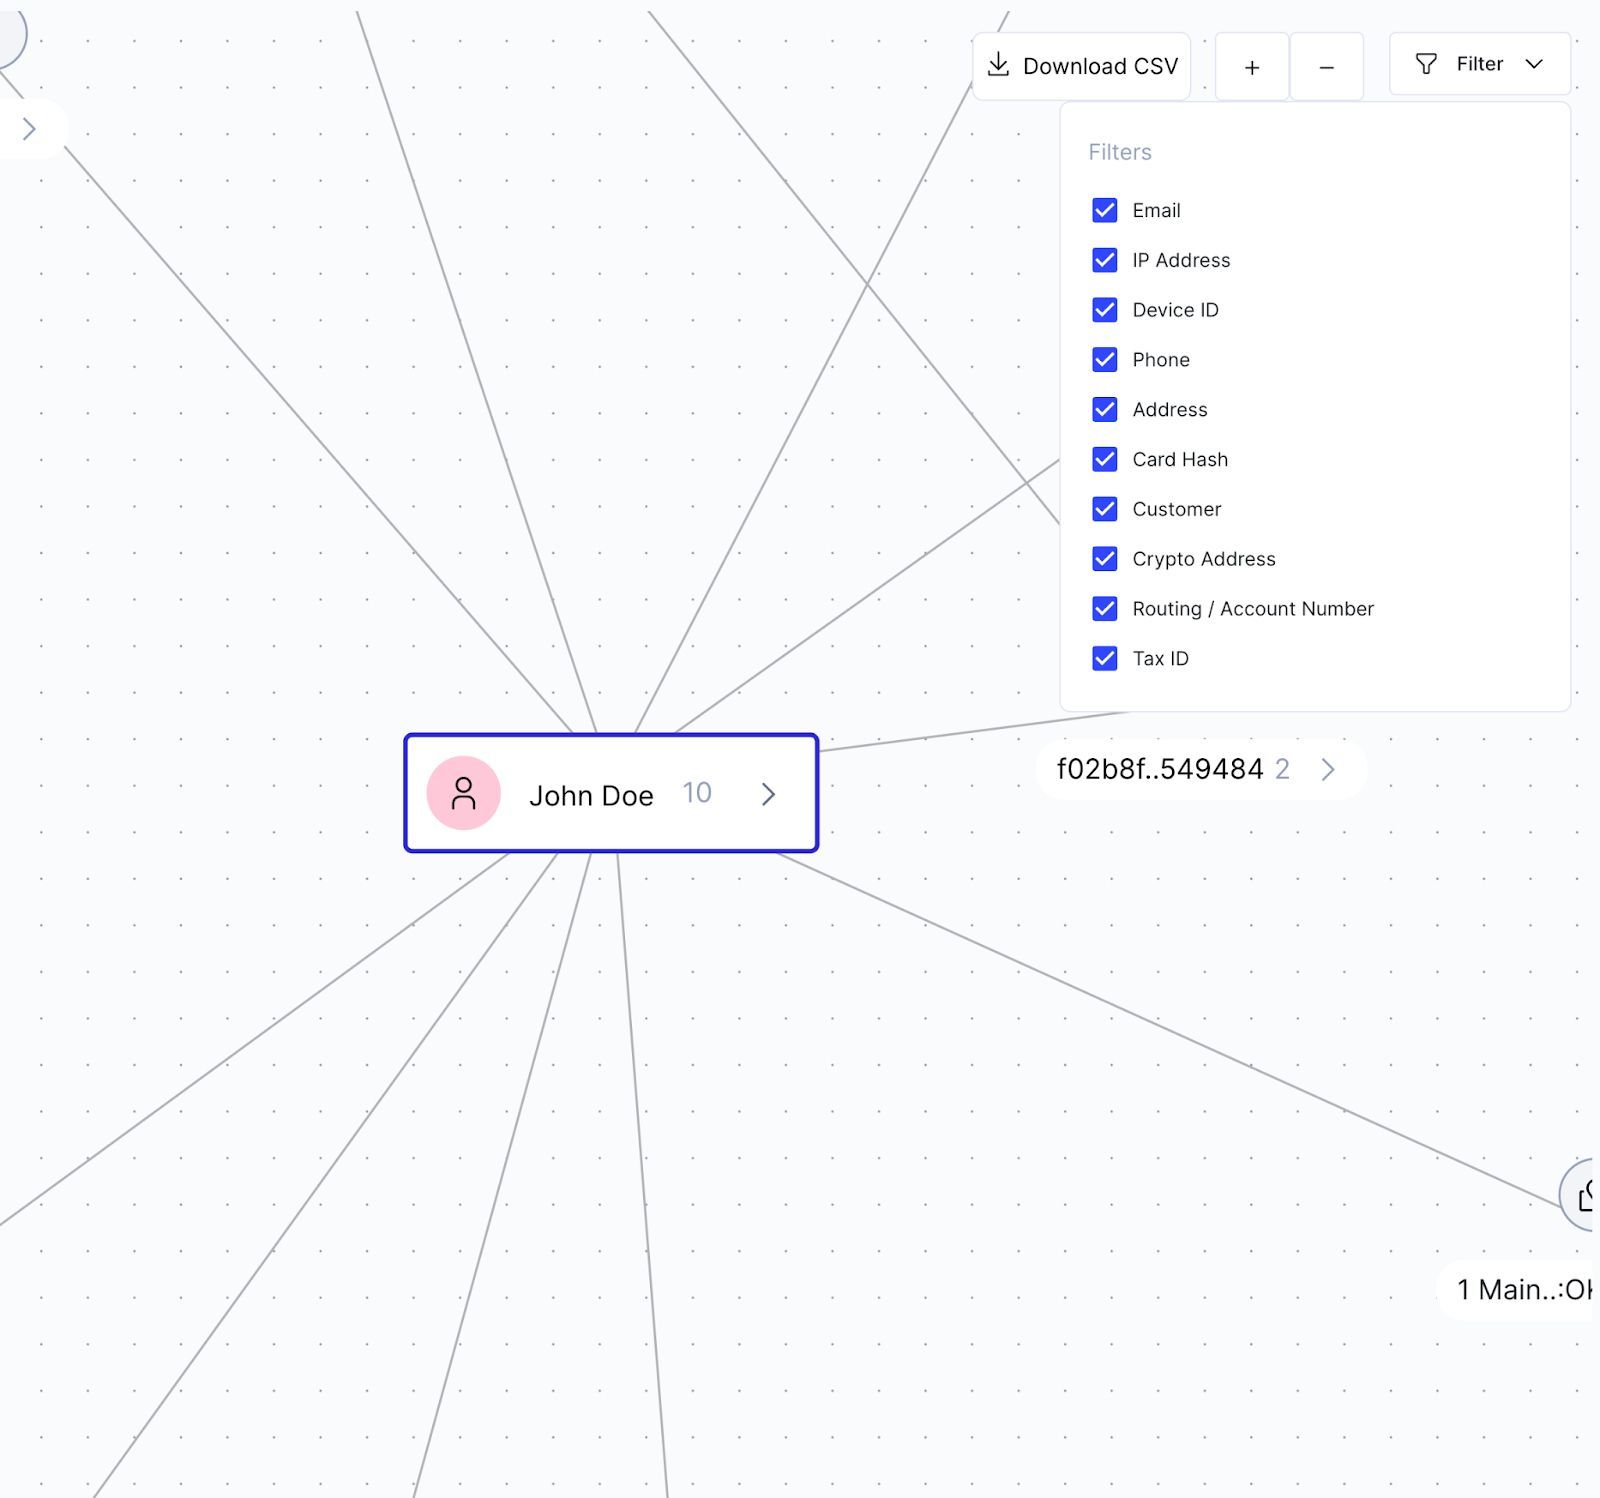
To provide users with the ability to filter nodes and edges based on their types or other properties, you can create a filtering panel that allows users to toggle the visibility of different node and edge types. You can then update the displayed nodes and edges in the graph based on the user's selections.
Context Menus
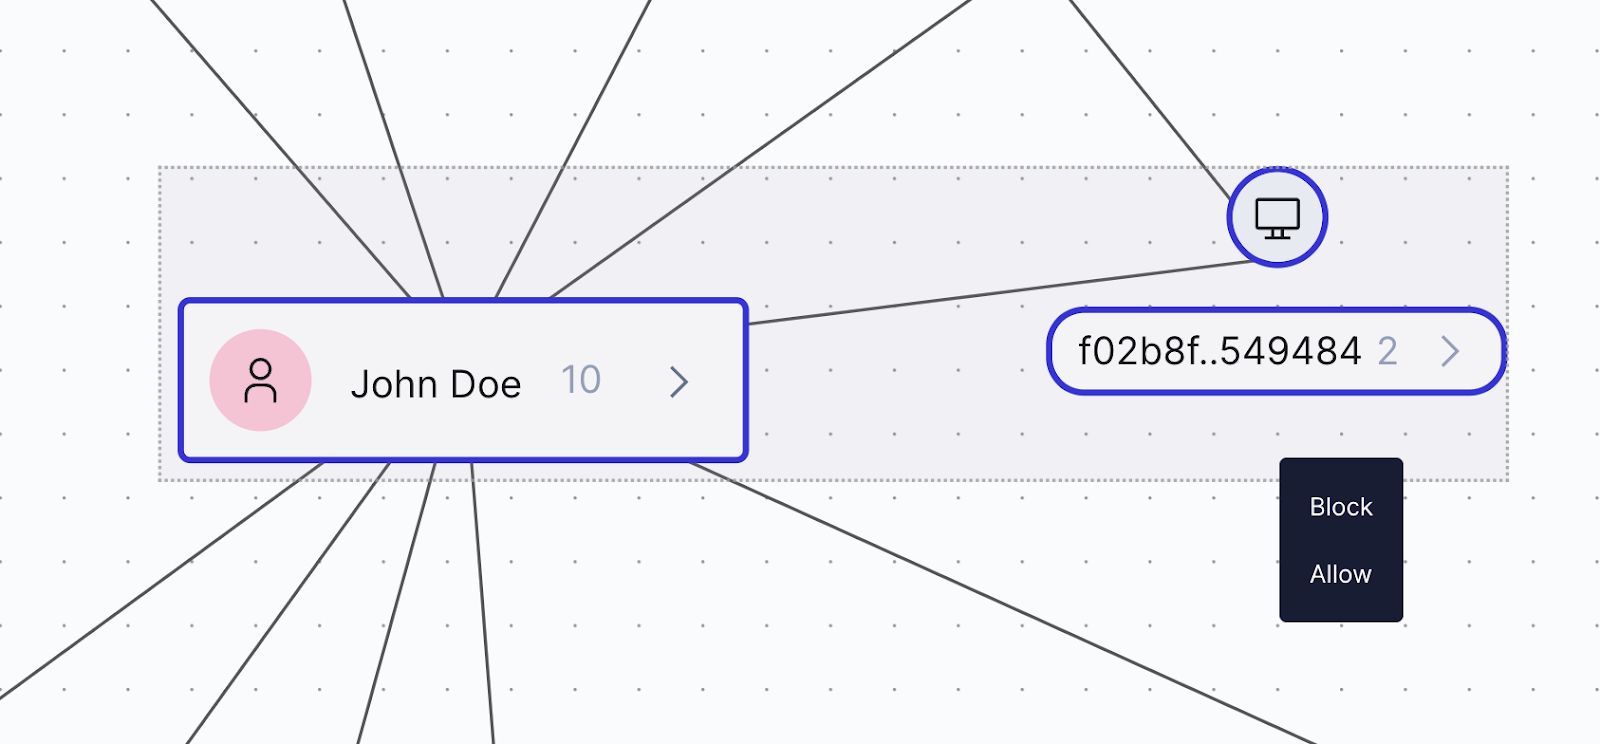
To provide users with context-specific actions, you can implement context menus that appear when users right-click on nodes, edges, or the background of the graph. These context menus can offer actions such as adding or removing nodes, editing edge properties, or navigating to related resources.
Tooltips
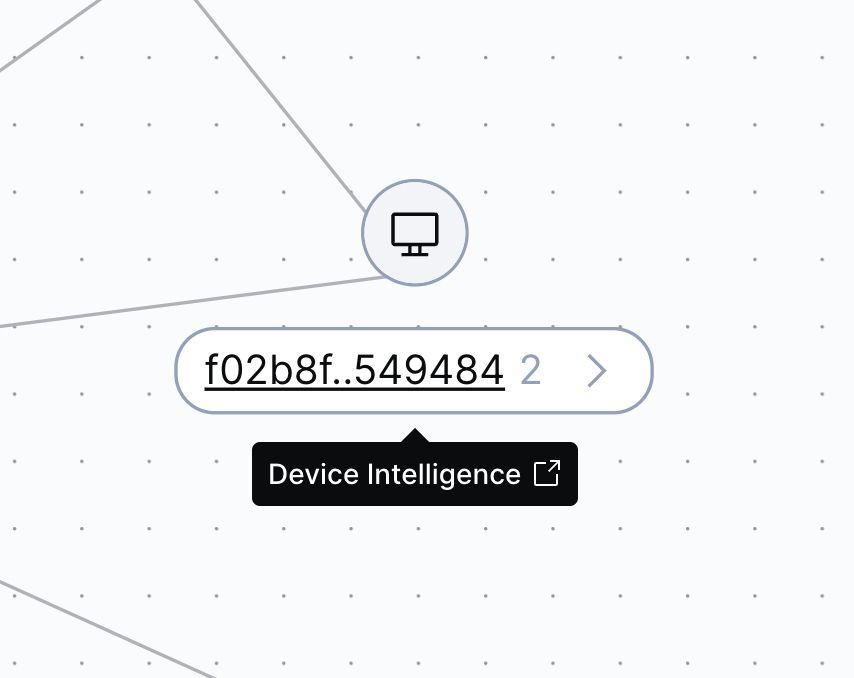
To provide users with additional information about nodes and edges, you can implement tooltips that appear when users hover over graph elements. Tooltips can display properties such as node and edge labels, metadata, and other relevant information.
Conclusion
In conclusion, by leveraging the power of React Flow and its various customization options, you can create a highly interactive and visually appealing network visualization tool that meets your specific requirements. This will enable users to explore and analyze data effectively, leading to better insights and decision-making.
Remember to experiment with different layout algorithms and customization options to find the best fit for your use case. The possibilities are endless, and with the right combination of features and design, you can create a truly remarkable network visualization experience.