


Every fraud leader has been asked some version of "How do we compare to our peers?"
Until now, the answer usually came from Call Report data, conference hallway chats, and a few friends at other institutions. Those peer conversations are a valuable starting point, but they’re anecdotal, which makes it hard to put them in front of your executives or your board. And while the regulatory reports that banks and credit unions file each quarter can provide a broad overview, they rarely speak to the fraud questions leaders are wrestling with day to day.
So we went to the people running these programs. We surveyed 165 fraud leaders at community banks, regional banks, and credit unions about losses, staffing, technology, reporting, and budget. Their answers point to six takeaways for anyone benchmarking a fraud program.
1. Losses are climbing, and scams are a big reason
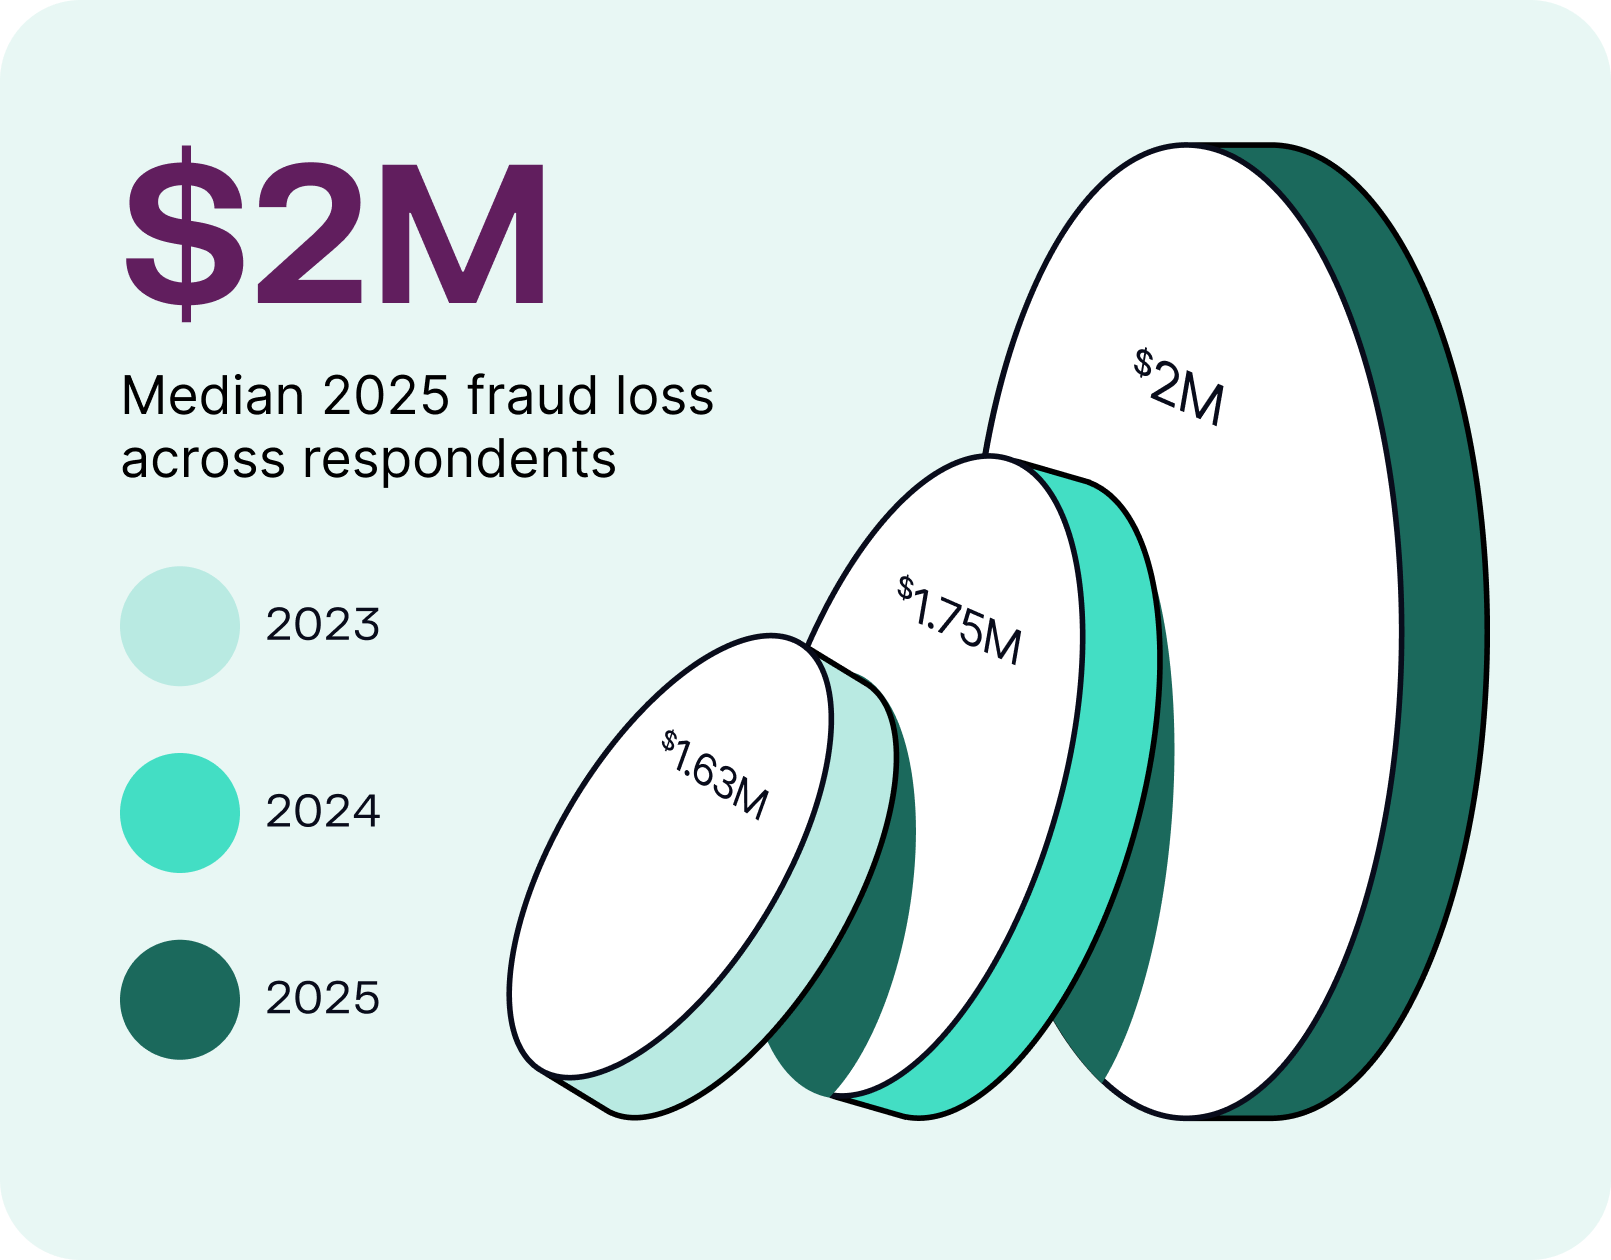
Respondents reported a median fraud loss of $1.63M in 2023, $1.75M in 2024, and $2M in 2025, and nearly three-quarters told us their losses are going up. Not every respondent reported losses for all three years, so we calculated each year’s median from a slightly different group of institutions, and you should read the trend as a moving industry benchmark.
When we asked about threats, 67.7% of respondents named scams as one of their most pressing, far more than any other category. More than half (55.5%) estimate scams make up over a quarter of their 2025 fraud losses, and for 13.4%, scams are the majority of losses.
Fraud teams struggle to see the full picture of a scam through channel-by-channel reporting alone. A scammer can start with a phone call to the account holder, coach them through digital banking, and move the money out through an automated clearing house (ACH) transfer, a peer-to-peer (P2P) app, or a wire, touching several channels in one scam. Most institutions already track scam losses separately from other fraud, 57.1% fully and another 28.8% partially.
2. The fundamentals are already in place
Fraud leaders have most of the basics down pat. Nearly all of them prioritize alerts by risk (96.9%) and rely on proactive detection or a mix of proactive alerts & customer-reported fraud (93.3%). More than nine in 10 keep a formal fraud risk assessment, and 88.9% use analytics beyond static rules.
However, only about half of these teams connect with the rest of the institution, with 52.8% sharing data and workflows with Bank Secrecy Act/anti-money laundering (BSA/AML), cybersecurity, and enterprise risk teams. The other 47.2% still run fraud on separate or only partially connected systems, so those teams can’t always pass what they find to their risk and compliance counterparts.
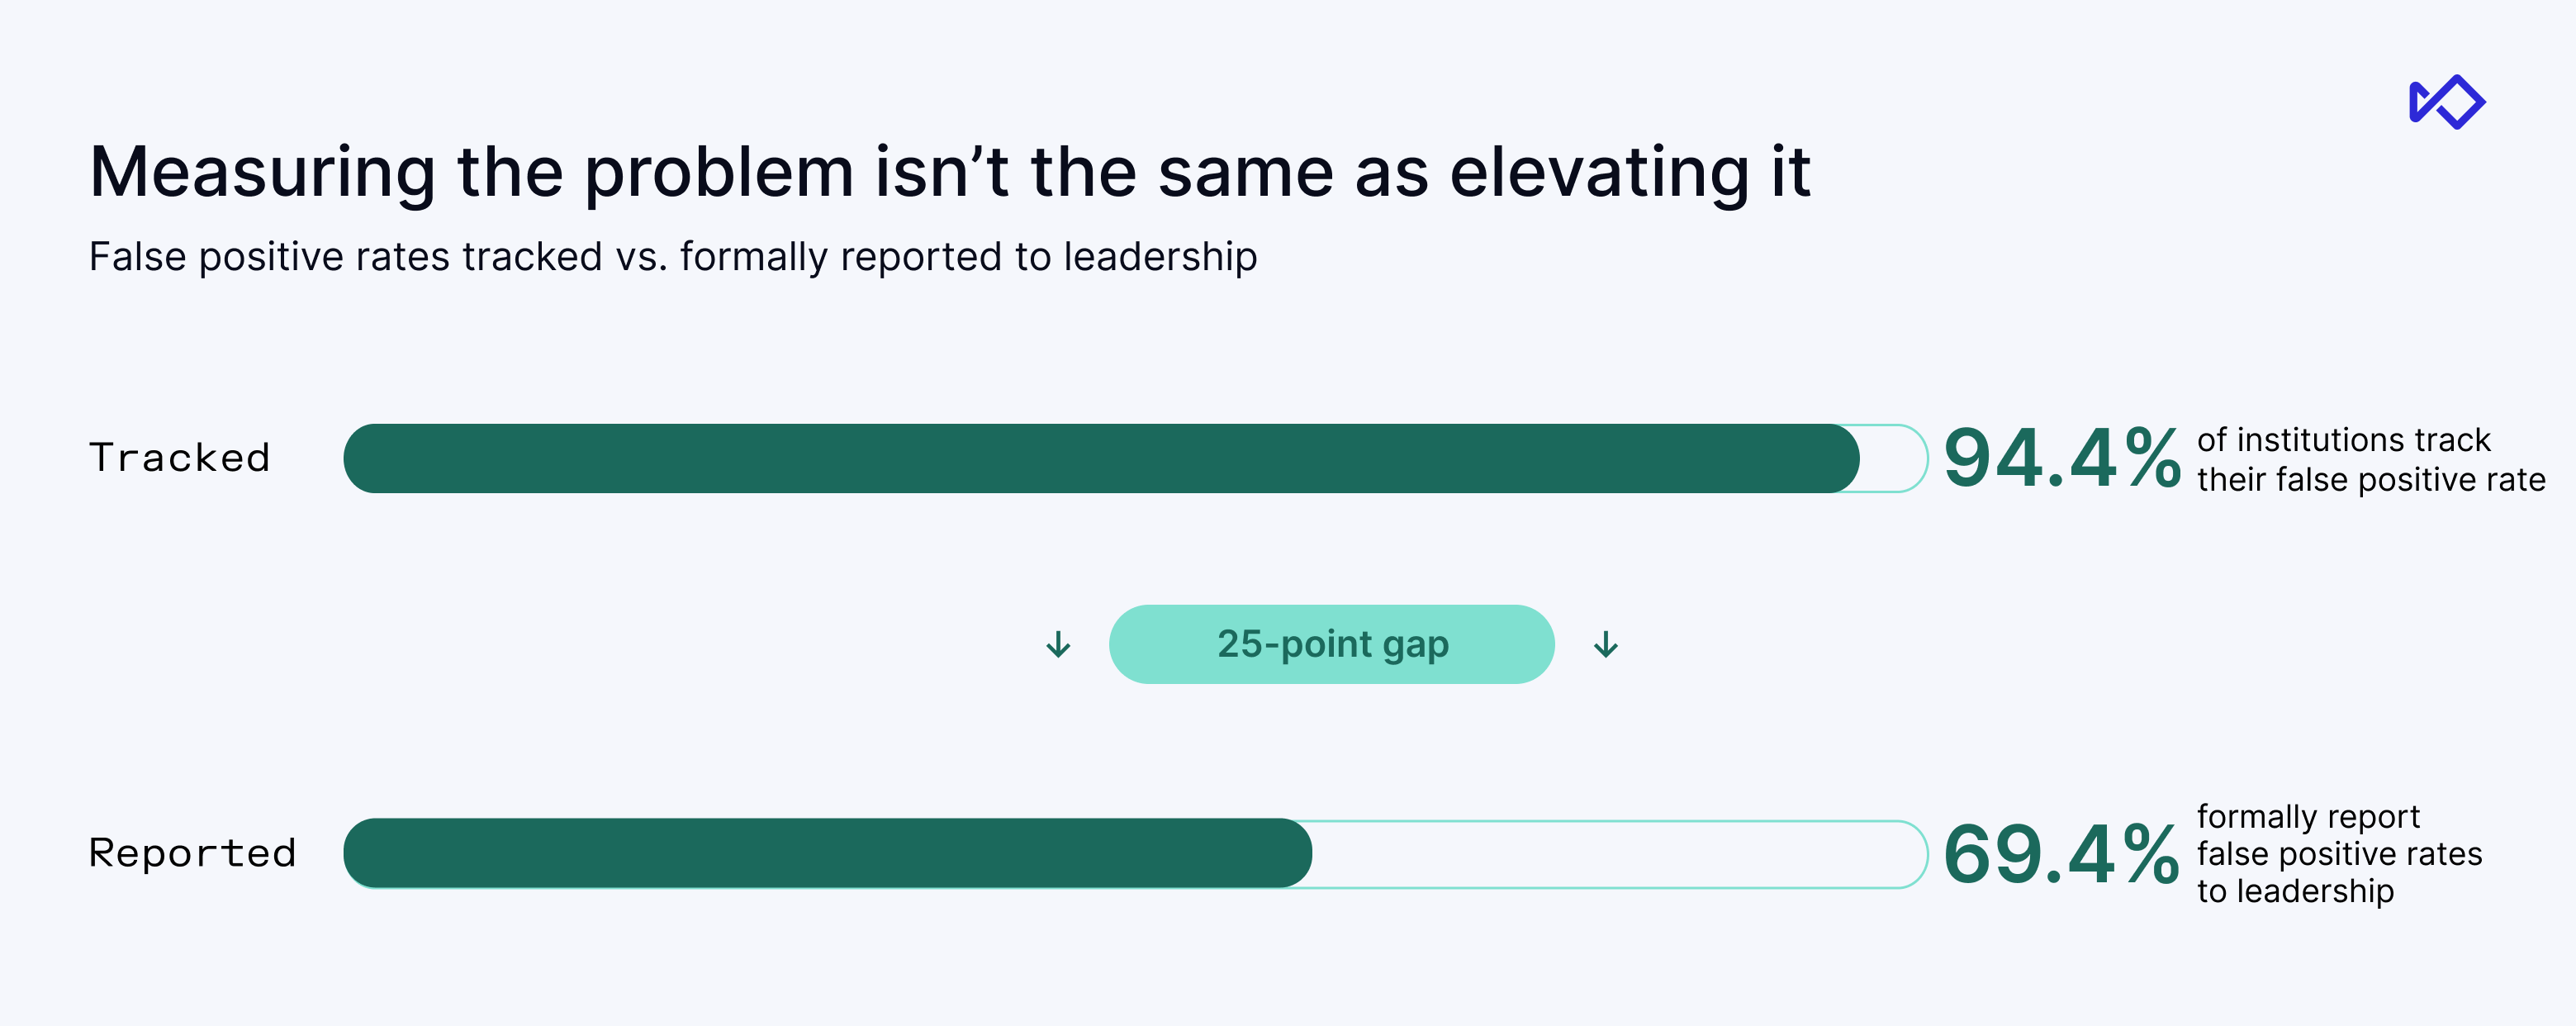
A quarter of teams also track a number they don’t regularly bring to leadership. While 94.4% track false positives, just 69.4% formally report that figure upward, which is a habit that comes up again in the technology findings below.
3. Strain is everywhere, and it isn't about alert volume or hiring
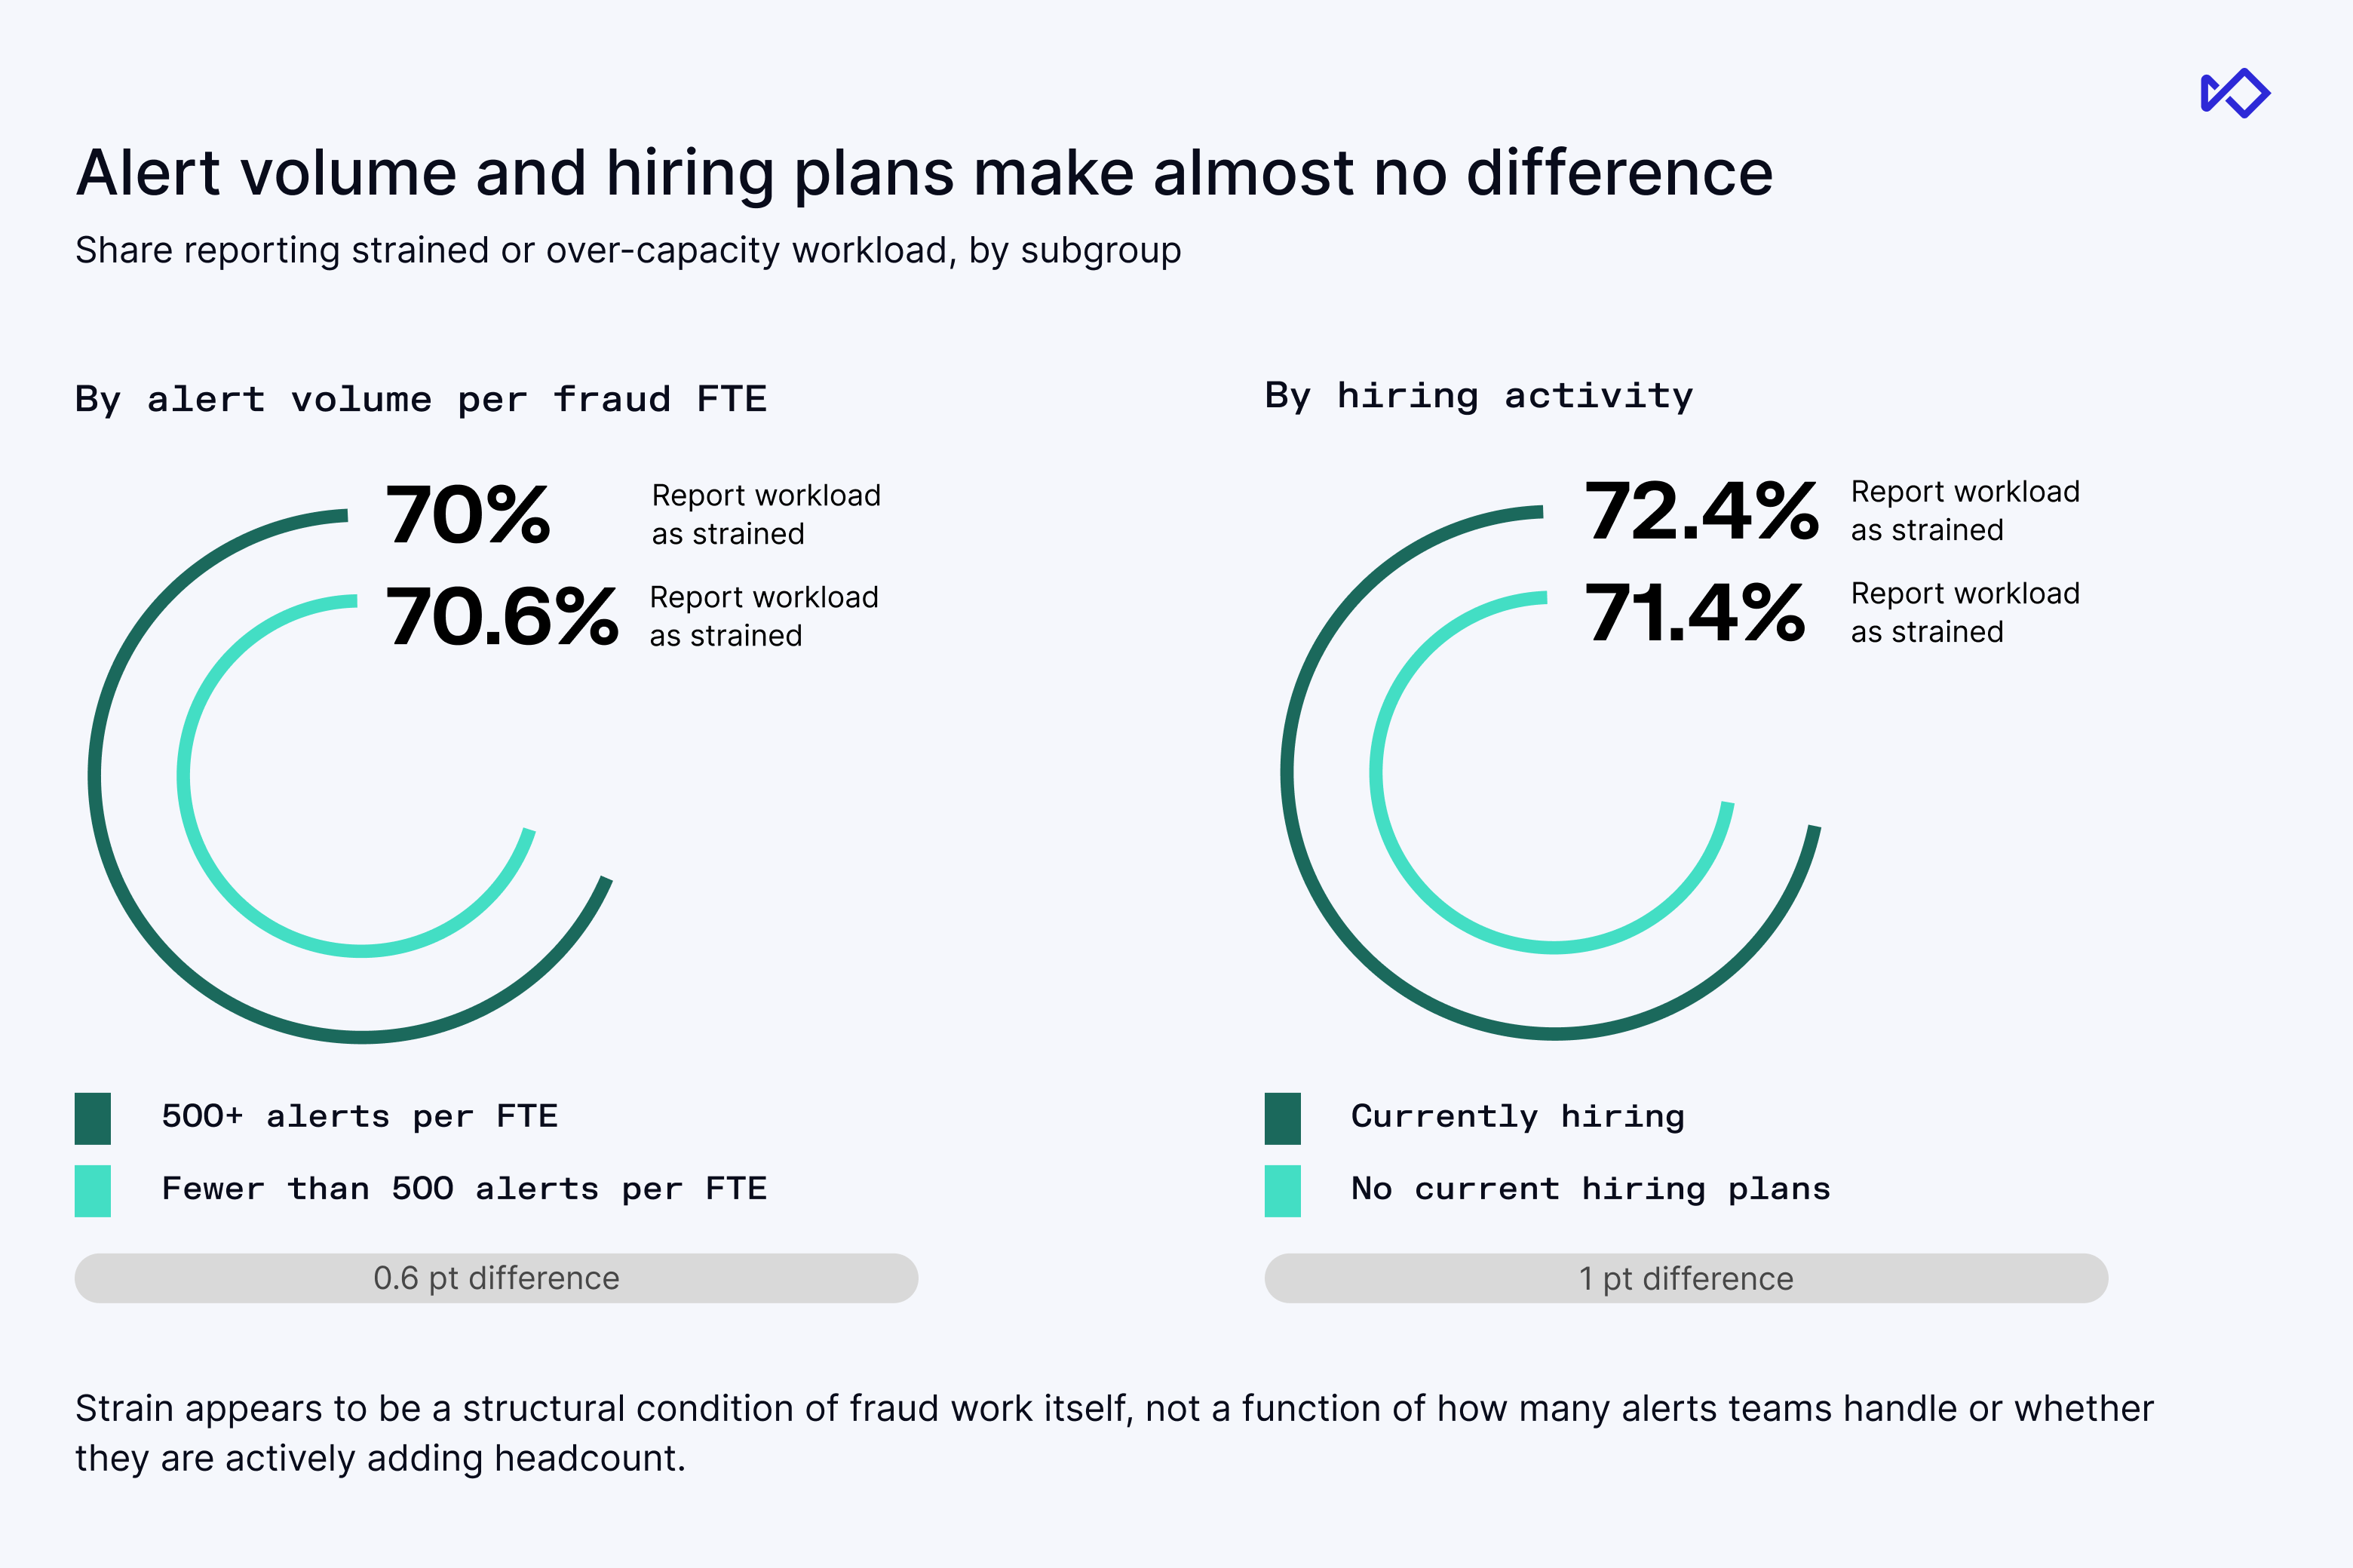
More than seven in 10 teams (71.1%) describe their workload as strained or over capacity. We expected alert volume or hiring to explain that strain, but neither one did. Teams handling more than 500 alerts per full-time employee report strain at 70.0%, compared with 70.6% for everyone else, while teams that are hiring feel it just as much, at 72.4% versus 71.4% for teams that aren’t.
We think it comes down to how teams count their work. Clearing a five-minute false positive and working a multi-account scam case with law enforcement requests both count as one alert, so a leadership team looking at alert totals only sees a fraction of what your analysts actually do all day. If you’re making the case for more headcount, you need to measure and present the work behind the alerts.
4. Reporting is one of your strongest levers
Almost every respondent (94.3%) has watched leadership act on a fraud report. Leaders most often invested in technology (70.1%), changed policy (62.4%), or increased the budget (51%).
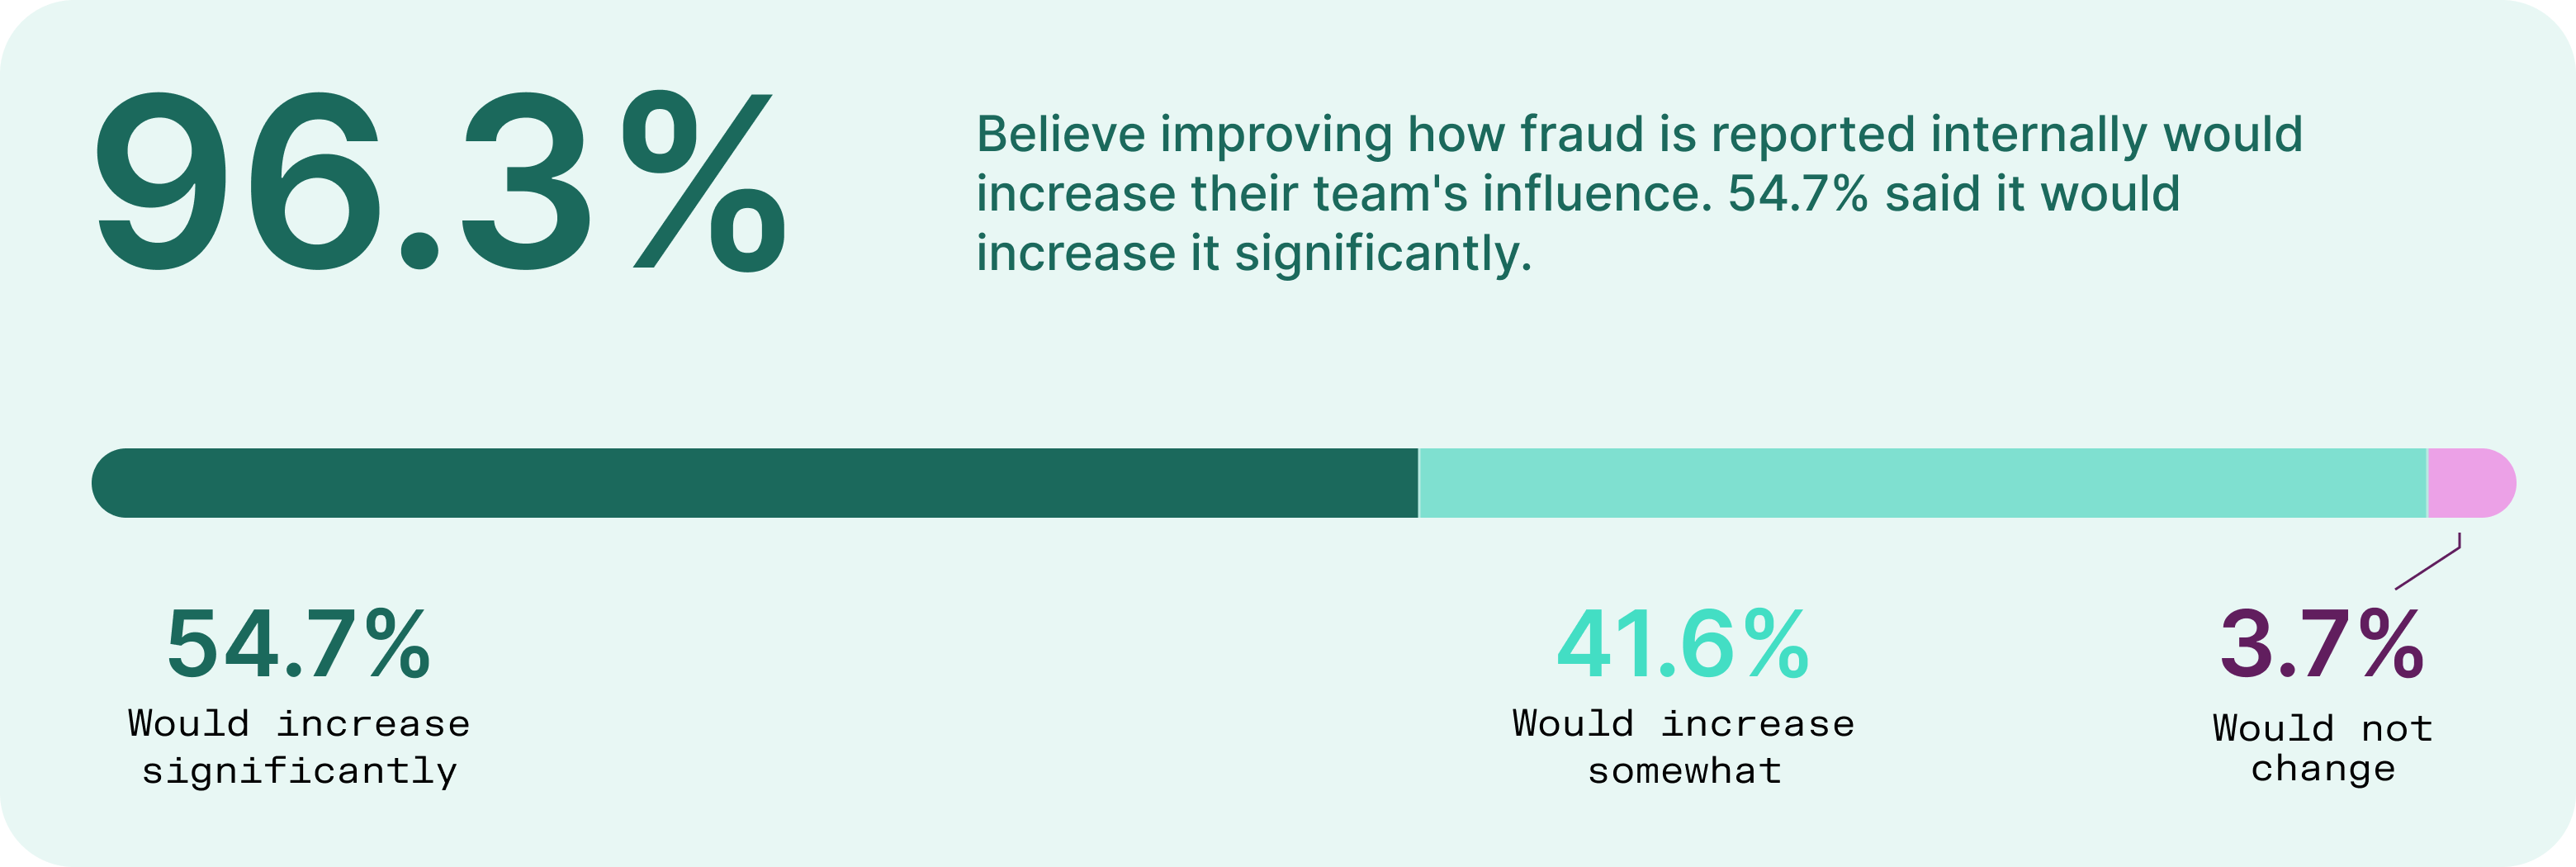
How you build the report changes how far it goes. 95.8% of teams whose reports combine losses, operational performance, and forward-looking risk got at least two kinds of leadership action, versus 77% of teams that send narrower reports. Fraud leaders seem to know this already, since 96.3% believe better internal reporting would give them more influence.
5. Technology satisfaction is high, but so is the friction
Fraud leaders rate their tools well overall, and 84% told us they’re satisfied with their fraud technology. But they also had no trouble listing frustrations. When we asked about pain points, 62.3% pointed to high false positives, half (50.3%) wanted more rule flexibility, and 45% struggled with weak core integration and reporting.
Institutions that formally report their false-positive rate are far happier with their technology, at 90% satisfaction versus 71.4% for those that track it less formally or not at all.
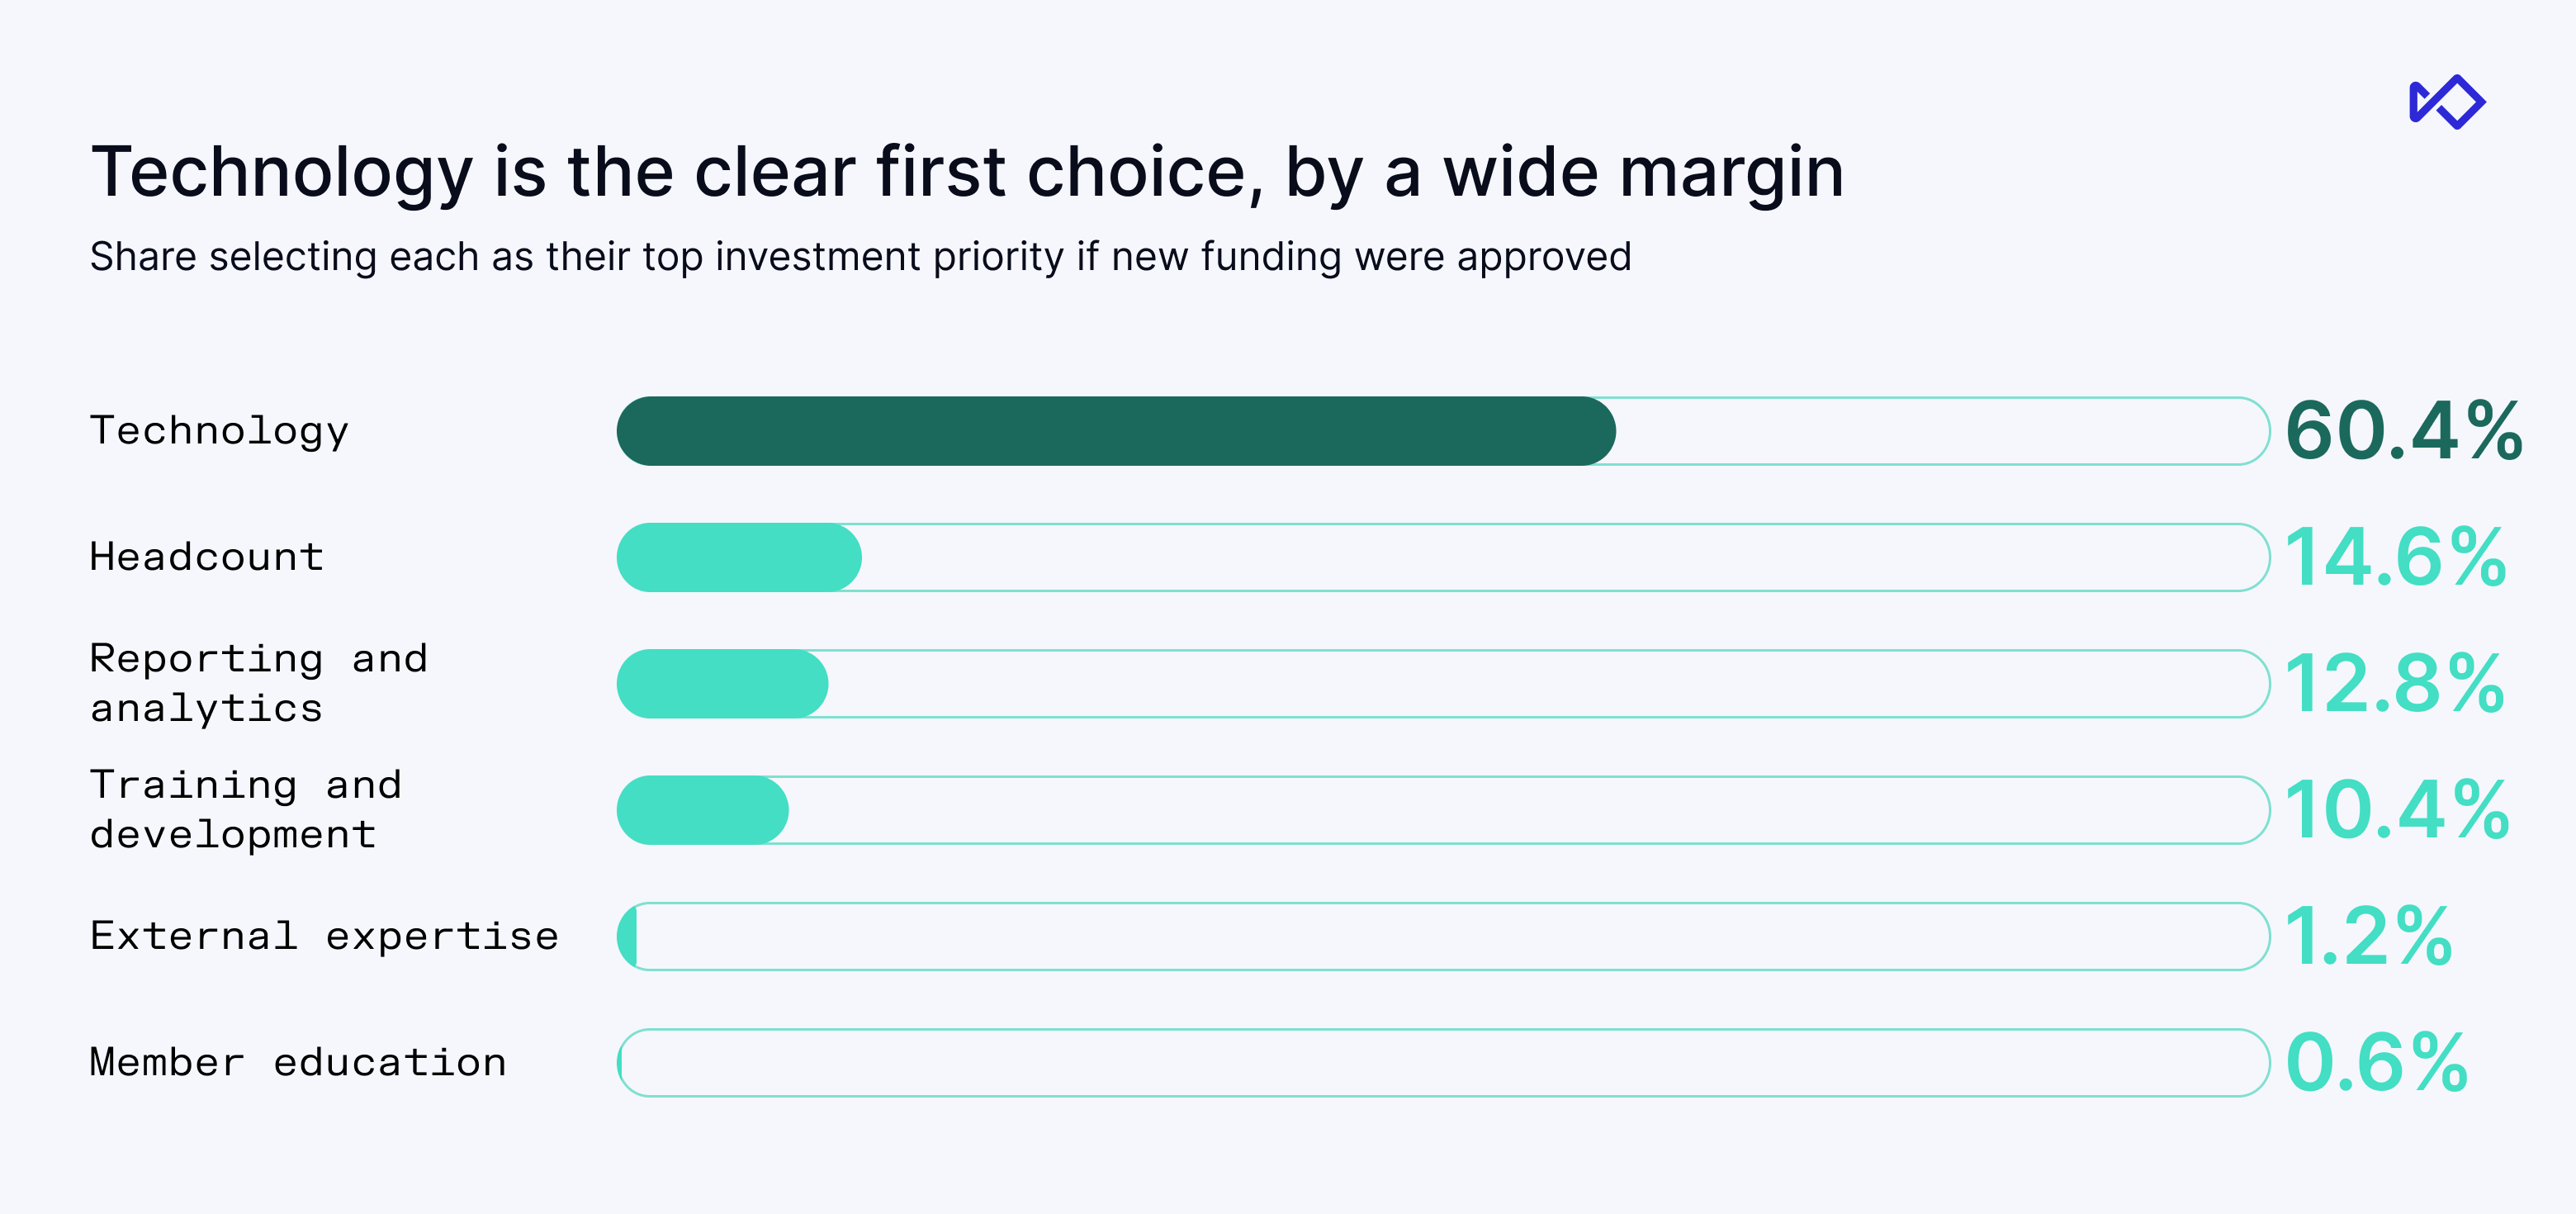
Even so, most respondents would spend their next dollar on technology (60.4%), more than four times the share who’d put it toward headcount (14.6%). I would advise before you buy another platform, ask whether your team is tuning, measuring, and holding vendors accountable for the tools you already have.
6. Prevented fraud is the value leaders can't quite prove
Nearly every respondent (95.4%) tracks prevented or attempted fraud in some form, yet only 58.8% report it formally. Fraud leaders also want leadership to understand prevented fraud more than anything else, with 62.8% naming it, the most of any answer.
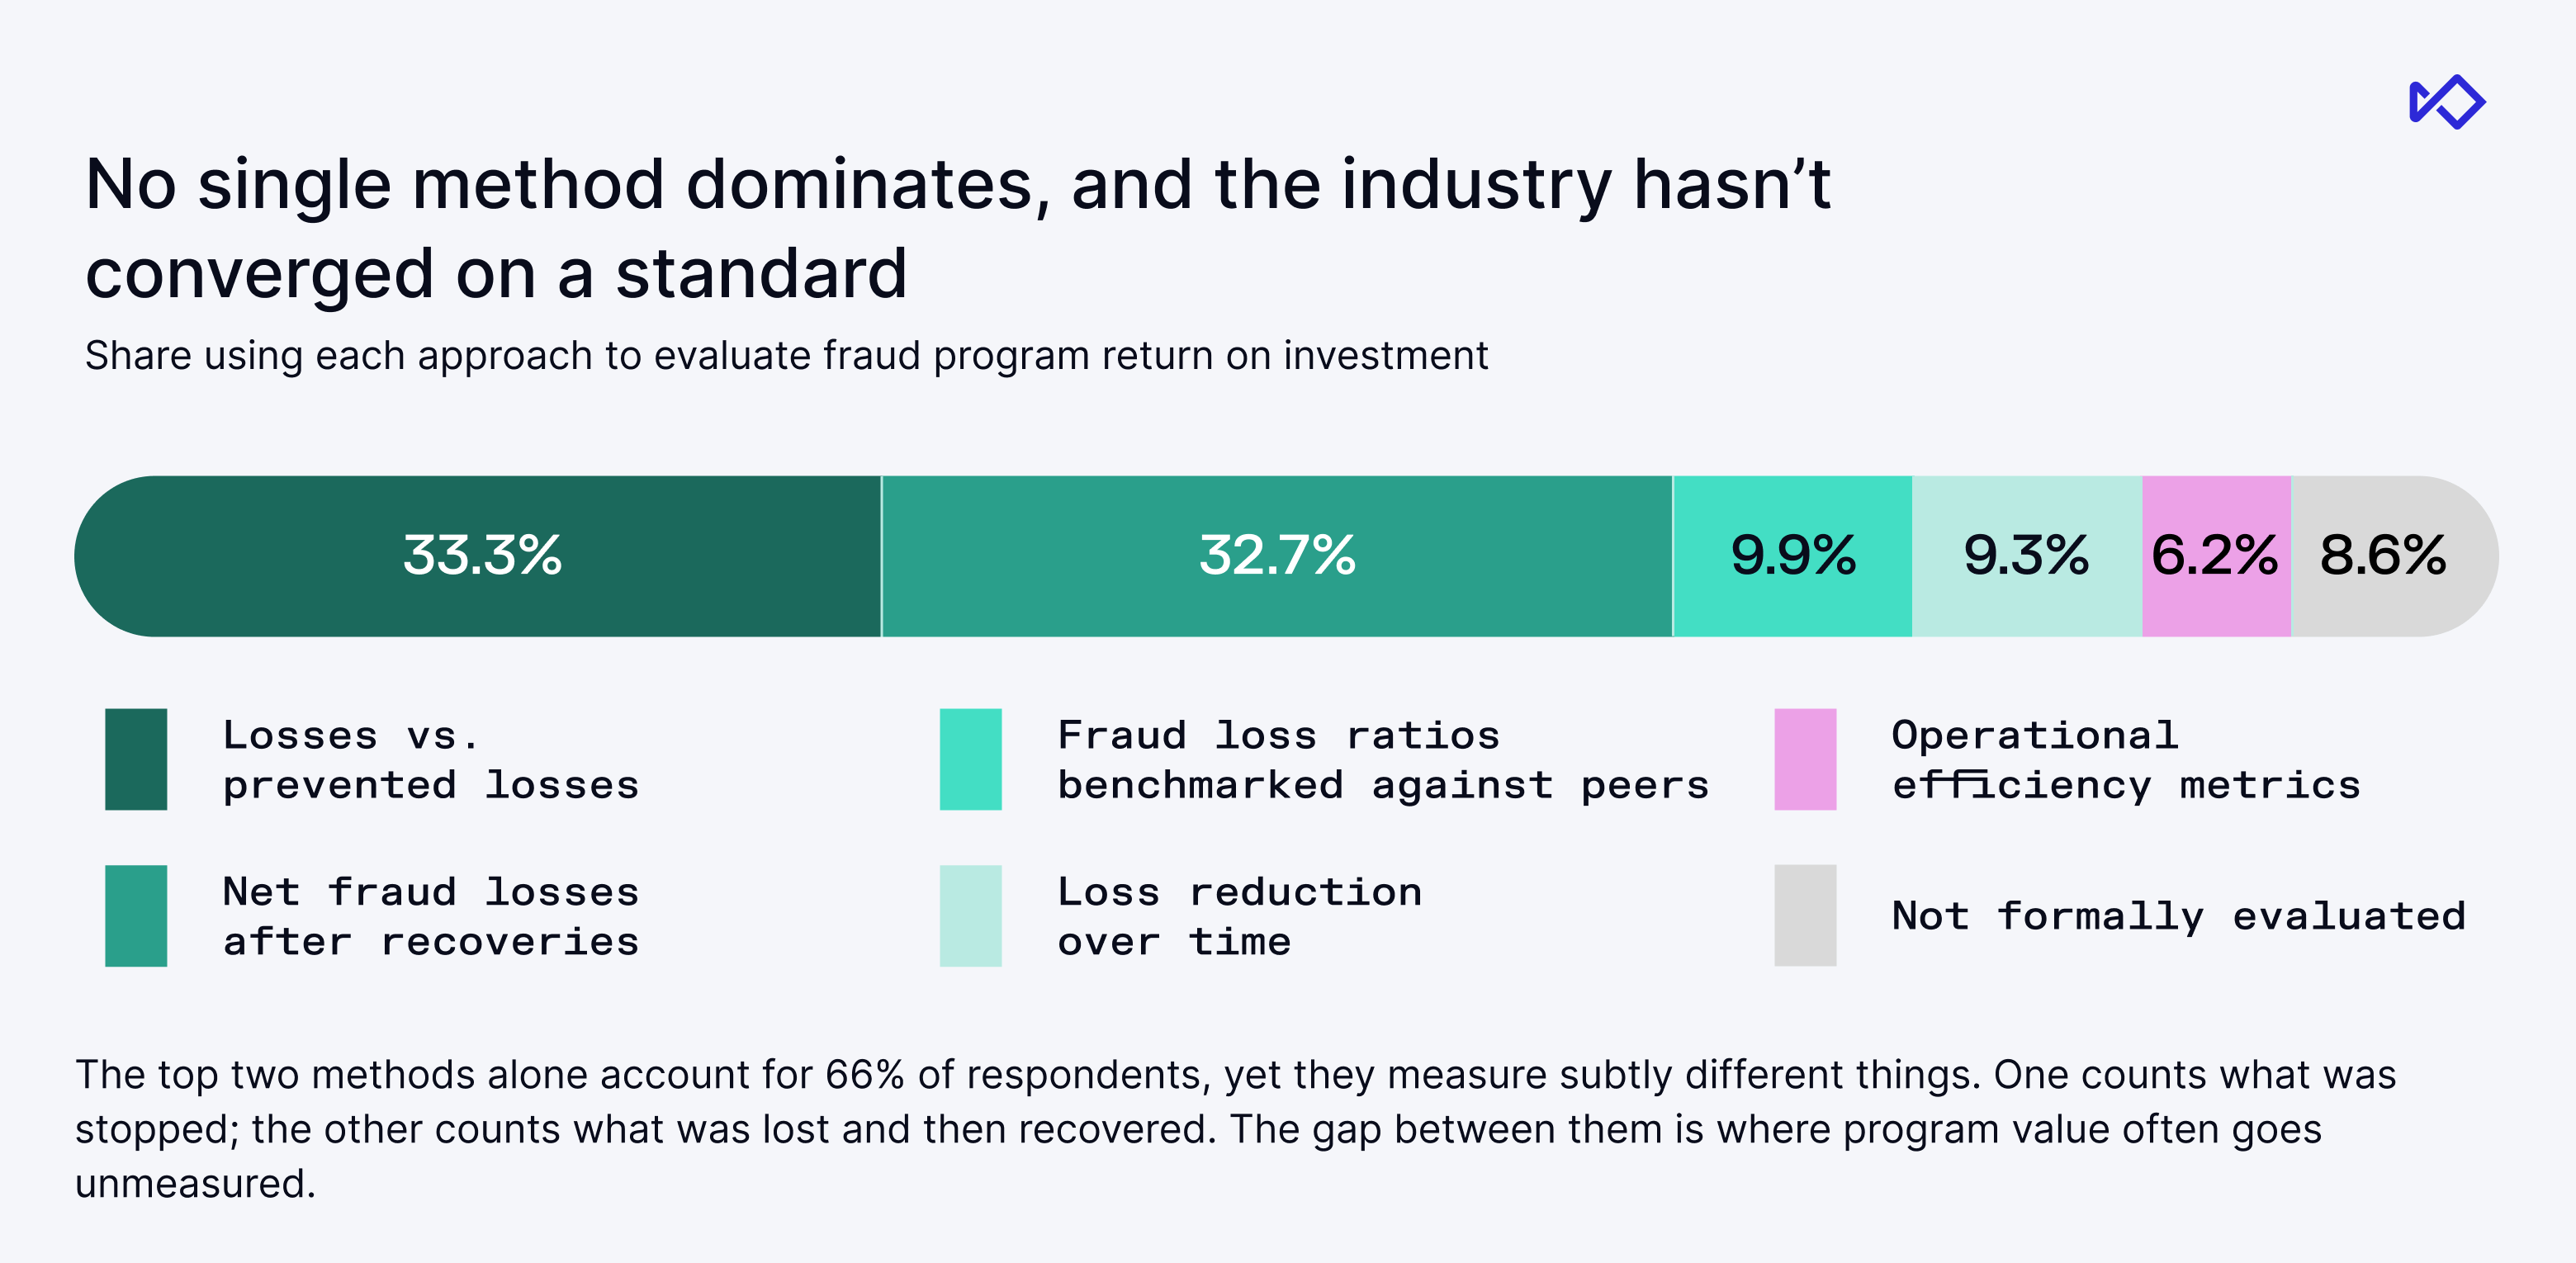
Without a shared definition of fraud ROI, each institution builds its own. A third (33.3%) compare losses to prevented losses, 32.7% use net losses after recoveries, and the rest use other approaches.
Whichever method you choose, if you only report losses, leadership hears about the fraud that got through and nothing about what your team stopped or clawed back. Put prevented and recovered amounts beside the losses, using the same definition every quarter, so they can see the program working over time.
One caution: confidence isn't reconciliation
Respondents trust their numbers, with 91.3% saying they’re confident in their internal loss data. When we added up each institution’s channel-level losses and compared the sum to its reported 2025 total, only 45.8% of the 142 comparable responses matched within ±20%.
Overlapping definitions may explain part of the gap, especially when a team could book the same scam loss under scams and under digital banking. Disconnected systems and manual processes widen it further. Forcing the numbers to match would only hide that overlap, so reconcile on a regular schedule, learn where your categories double count, and be ready to explain the difference when leadership asks.
How to use these benchmarks
Skip the survey-wide average when you compare your program. A $400 million credit union and a $10 billion regional bank shouldn’t draw the same conclusion from the same number. Start with peers that look like you in asset size, institution type, and customer base, and use the broader data for context.
Then pair that peer view with stronger reporting: the losses, the saves, and the recoveries. Together, they tell leadership the full story of what your team is accomplishing.
The next time your board asks how you stack up, you won’t be guessing. You’ll have verifiable data, a clear peer group, and the evidence to show your program’s impact.
Download the full benchmarking report and see how your program compares to peers your size → https://www.sardine.ai/whitepapers/fraud-benchmarking-report