This month’s releases focus on the everyday parts of fraud and compliance work that can slow teams down: finding the right context, keeping queues manageable, understanding how a review progressed, and getting the information needed to make a decision.
A lot of these improvements are shaped by the day-to-day workflows our customers are trying to make faster, clearer, and easier to manage in Sardine. Custom widgets give reviewers more control over what they see in Session and Transaction Details, Alert History now captures a fuller audit trail, and new CDD filters make it easier to organize and share review queues. We also added IBAN-based counterparty bank enrichment, business-level analytics, case archiving, and new stacked chart views.
The goal across all of them is the same: make the work around the decision easier, not just the decision itself.
Here’s what shipped in August.
The highlights:
- Custom widgets for Session and Transaction Details. Shape review pages around the fields and signals your team actually uses.
- Expanded Alert History. Follow the full story of an alert without reconstructing it from disconnected events.
- CDD review queue filters. Build and share the working queues your team uses to prioritize reviews.
- IBAN-based counterparty bank enrichment. Get the bank context needed for screening without sourcing it separately.
- Case archiving. Keep active queues focused without losing the status or history behind inactive work.
- Unified card details panel. Review card, BIN, AVS, CVV, and 3DS information together.
- Business profile analytics. Understand transaction and risk trends without leaving the business under review.
- New stacked chart views. Compare trends across a second dimension without rebuilding the analysis.
Fraud: Bring the right context into the investigation
Fraud investigations move faster when reviewers can see the right information without hunting across pages. This month’s updates make it easier to organize investigation views around your process and bring more card context directly into the review.
Organize session and transaction views with custom widgets
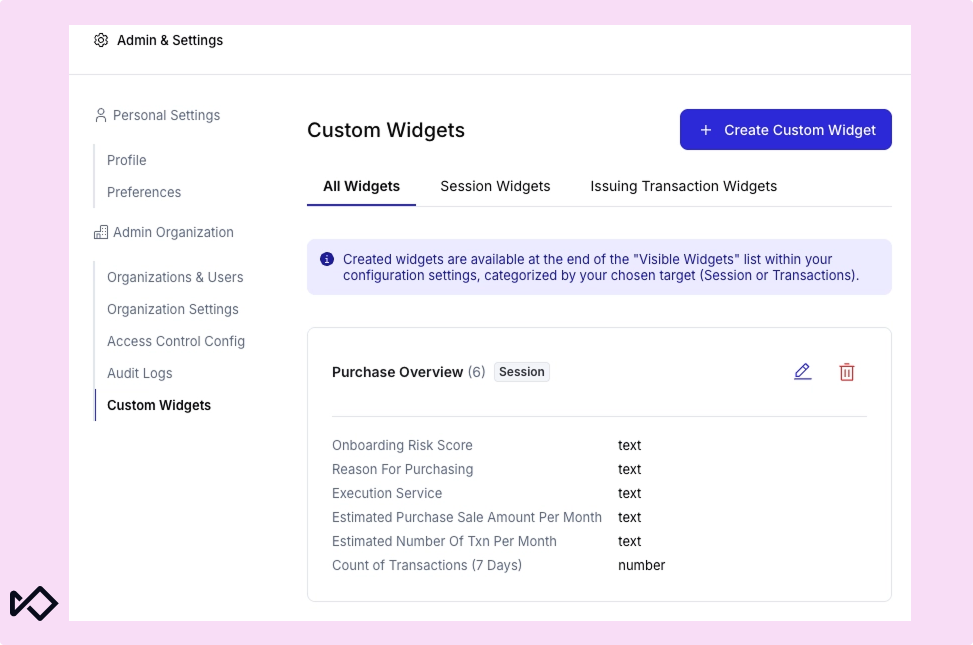
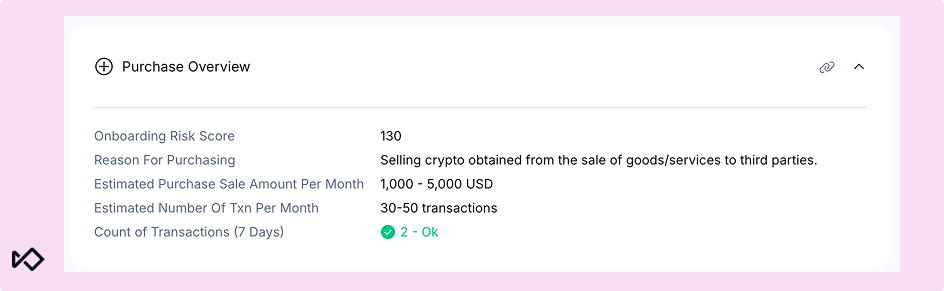
Session and Transaction Details can be organized around different review workflows. Instead of relying on the same generic field layout for every type of review, admins can build dedicated panels for different workflows and bring the most relevant information forward.
Custom panels can include custom fields, persistent tags, and advanced aggregations. Technical field keys can be renamed into plain-language labels, fields can be reordered, and panels can be targeted specifically to Session Details or Transaction Details pages.
Reviewers still have access to the underlying technical context through field tooltips, while Admins and Multi-org Admins control configuration and Analysts retain view-only access.
Teams can shape investigation pages around the review process they’re running instead of adapting every review to a fixed layout.
Review card details directly from customer profiles
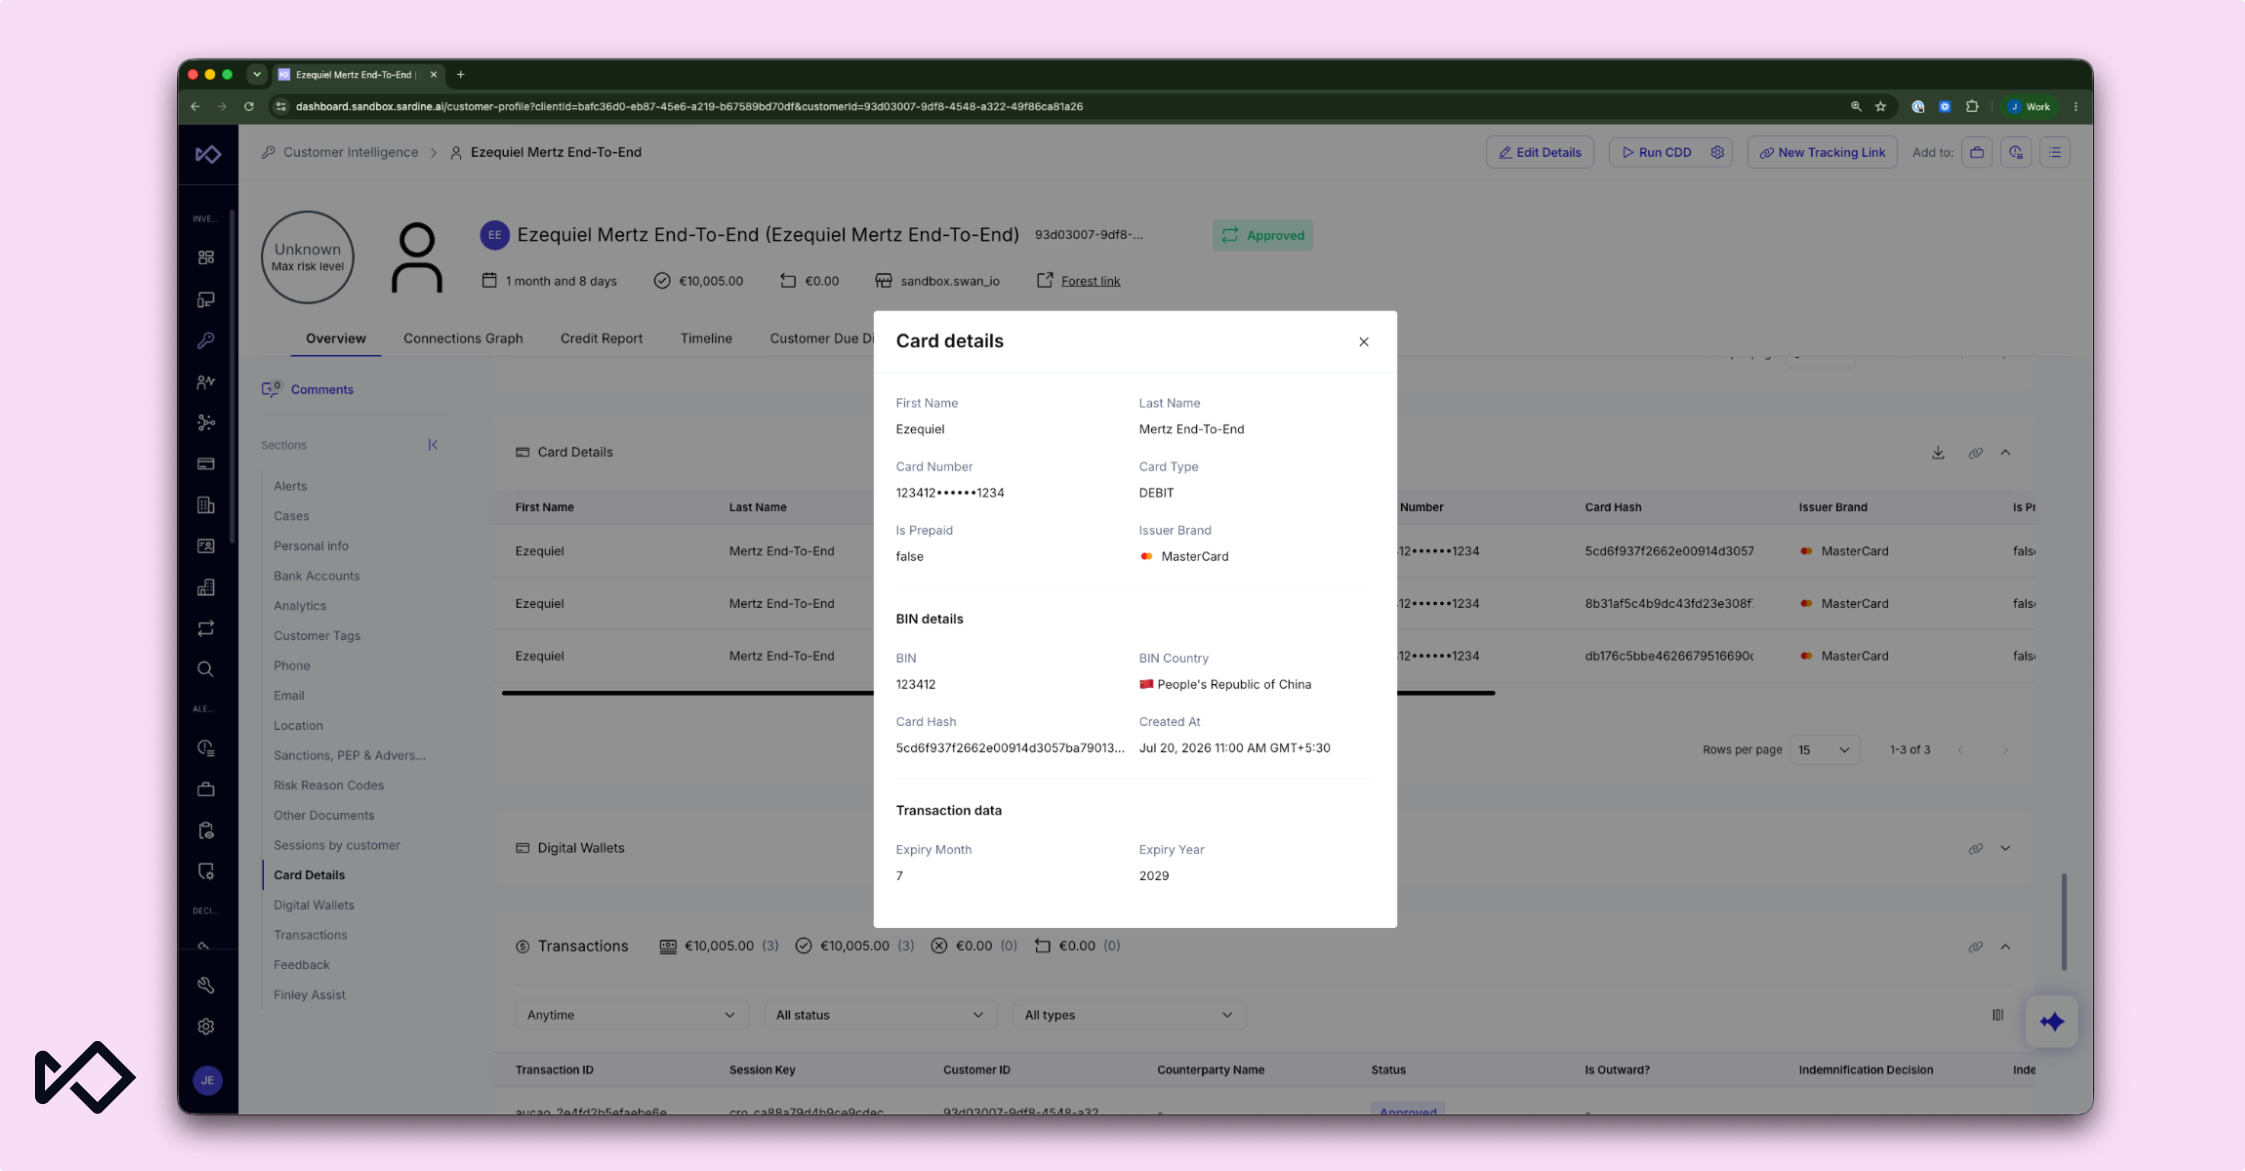
The card details panel brings card information, BIN metadata, and recent verification results into one view.
From a Customer Profile or Alert Overview, analysts can select a card to open a dedicated details panel. The view includes information such as issuing bank, BIN, country, city, postal code, and card hash, alongside the latest AVS, CVV, and 3DS results associated with the card.
The panel pulls verification results and expiration information from the card’s most recent transaction and automatically hides sections where no data is available.
Reviewers can assess the customer or alert with more of the relevant card context in one place.
AML Compliance: Make reviews easier to prioritize and screening easier to run
AML teams spend enough time making judgment calls. The surrounding workflow should make it easier to know what needs attention and bring the relevant context forward without adding more manual research.
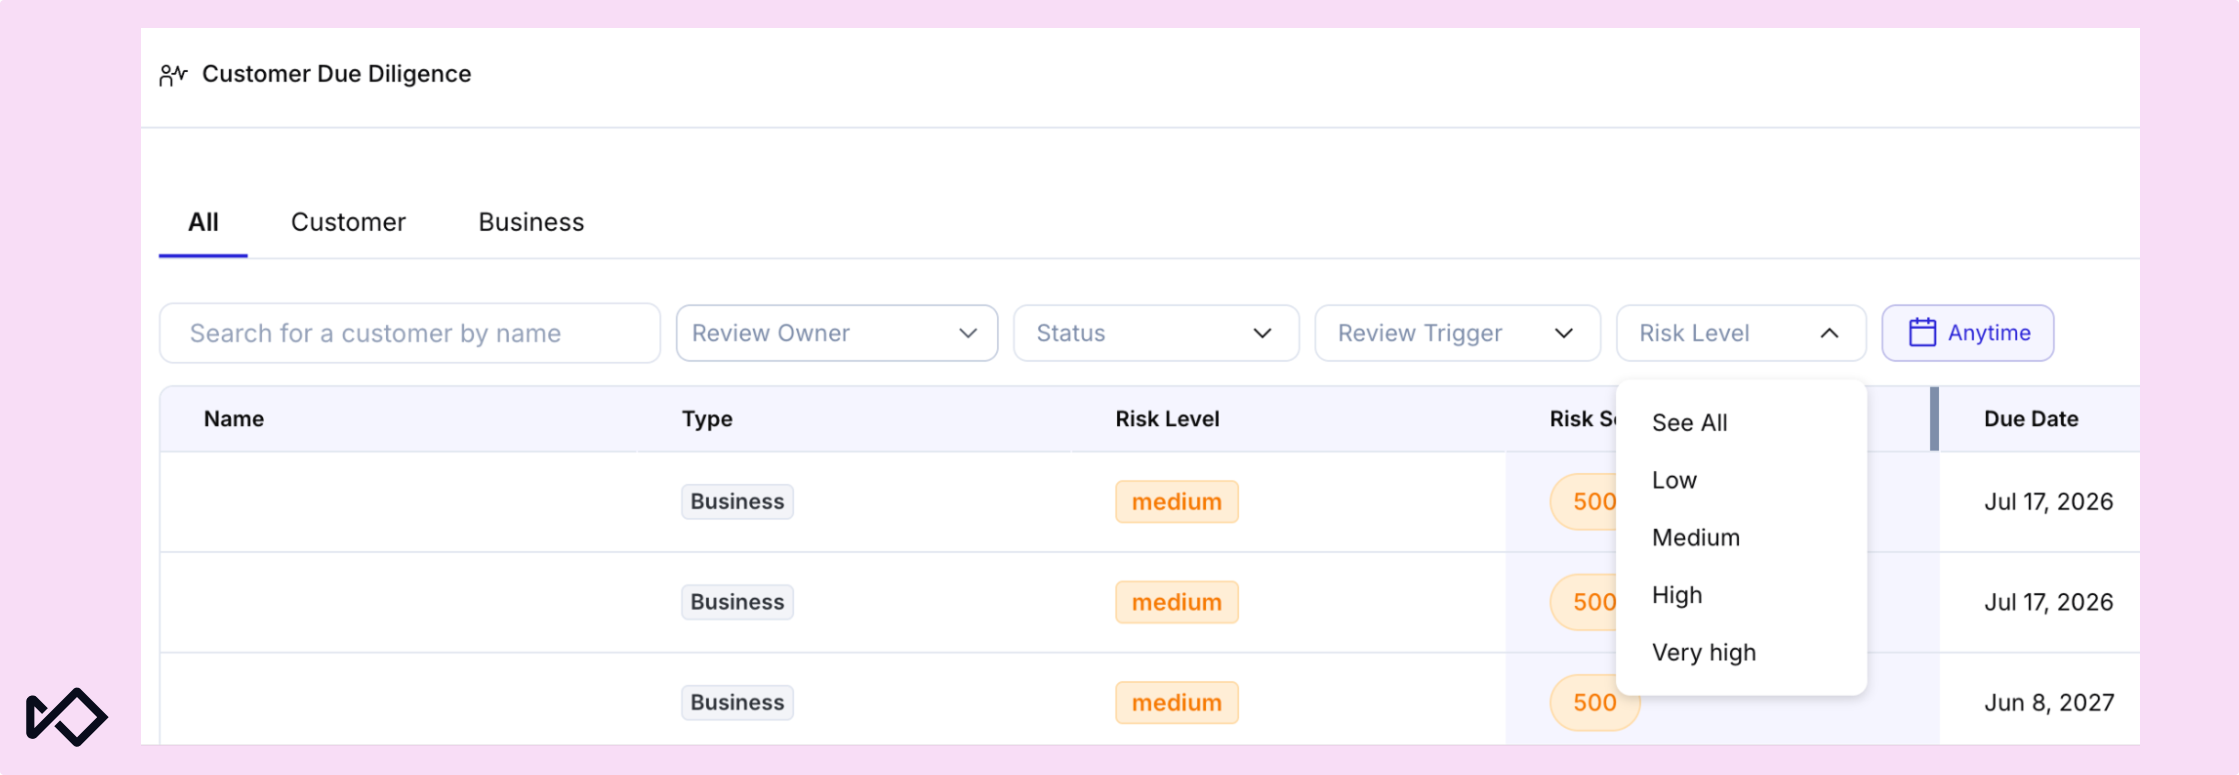
Filter and share CDD review queues
CDD review lists can be filtered into focused working queues based on status, trigger, owner, risk level, and due date. Risk filtering uses the effective risk level, including manual overrides, so teams can focus the queue around the risk state they are actually working from.
Filter selections are stored in the URL, which means teams can bookmark a recurring view or share a pre-filtered queue directly with another reviewer. The same filtering is also supported in the CDD ratings API.
Saved filter state makes it easy to return to the same working queue or share it with another reviewer.
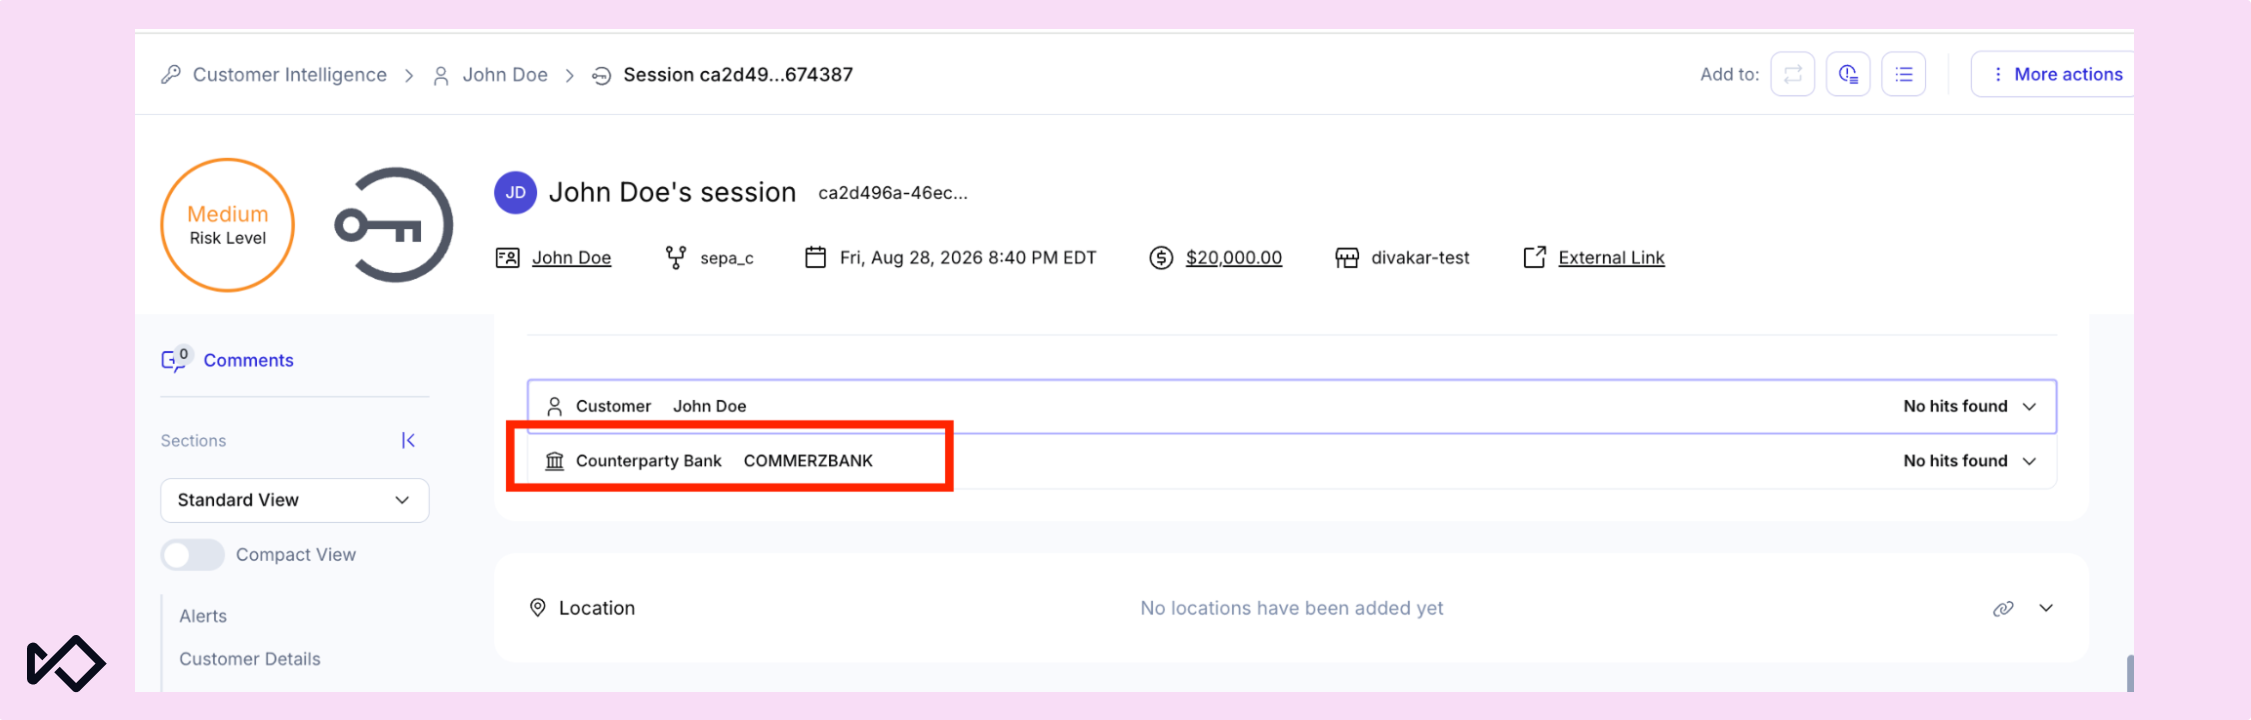
Resolve and screen counterparty banks using IBAN identifiers
IBANs provide the bank information needed for counterparty screening automatically, reducing what teams need to source separately.
When a transaction contains an IBAN, Sardine extracts the institution identifier using the SWIFT IBAN registry and resolves it against BIC reference data. That lookup returns the associated counterparty bank name and full BIC.
Screening can run using the bank name, BIC, or IBAN, so teams do not have to separately look up and attach the bank name or BIC before screening. The resolved institution information is also stored with the transaction and available to reviewers alongside the transaction details.
Case management: Keep investigations organized and auditable
Managing an investigation isn’t just about detecting risk. Teams also need to understand how a decision was reached, hand work between reviewers, and keep active queues focused without losing the history behind cases they may need to revisit later.
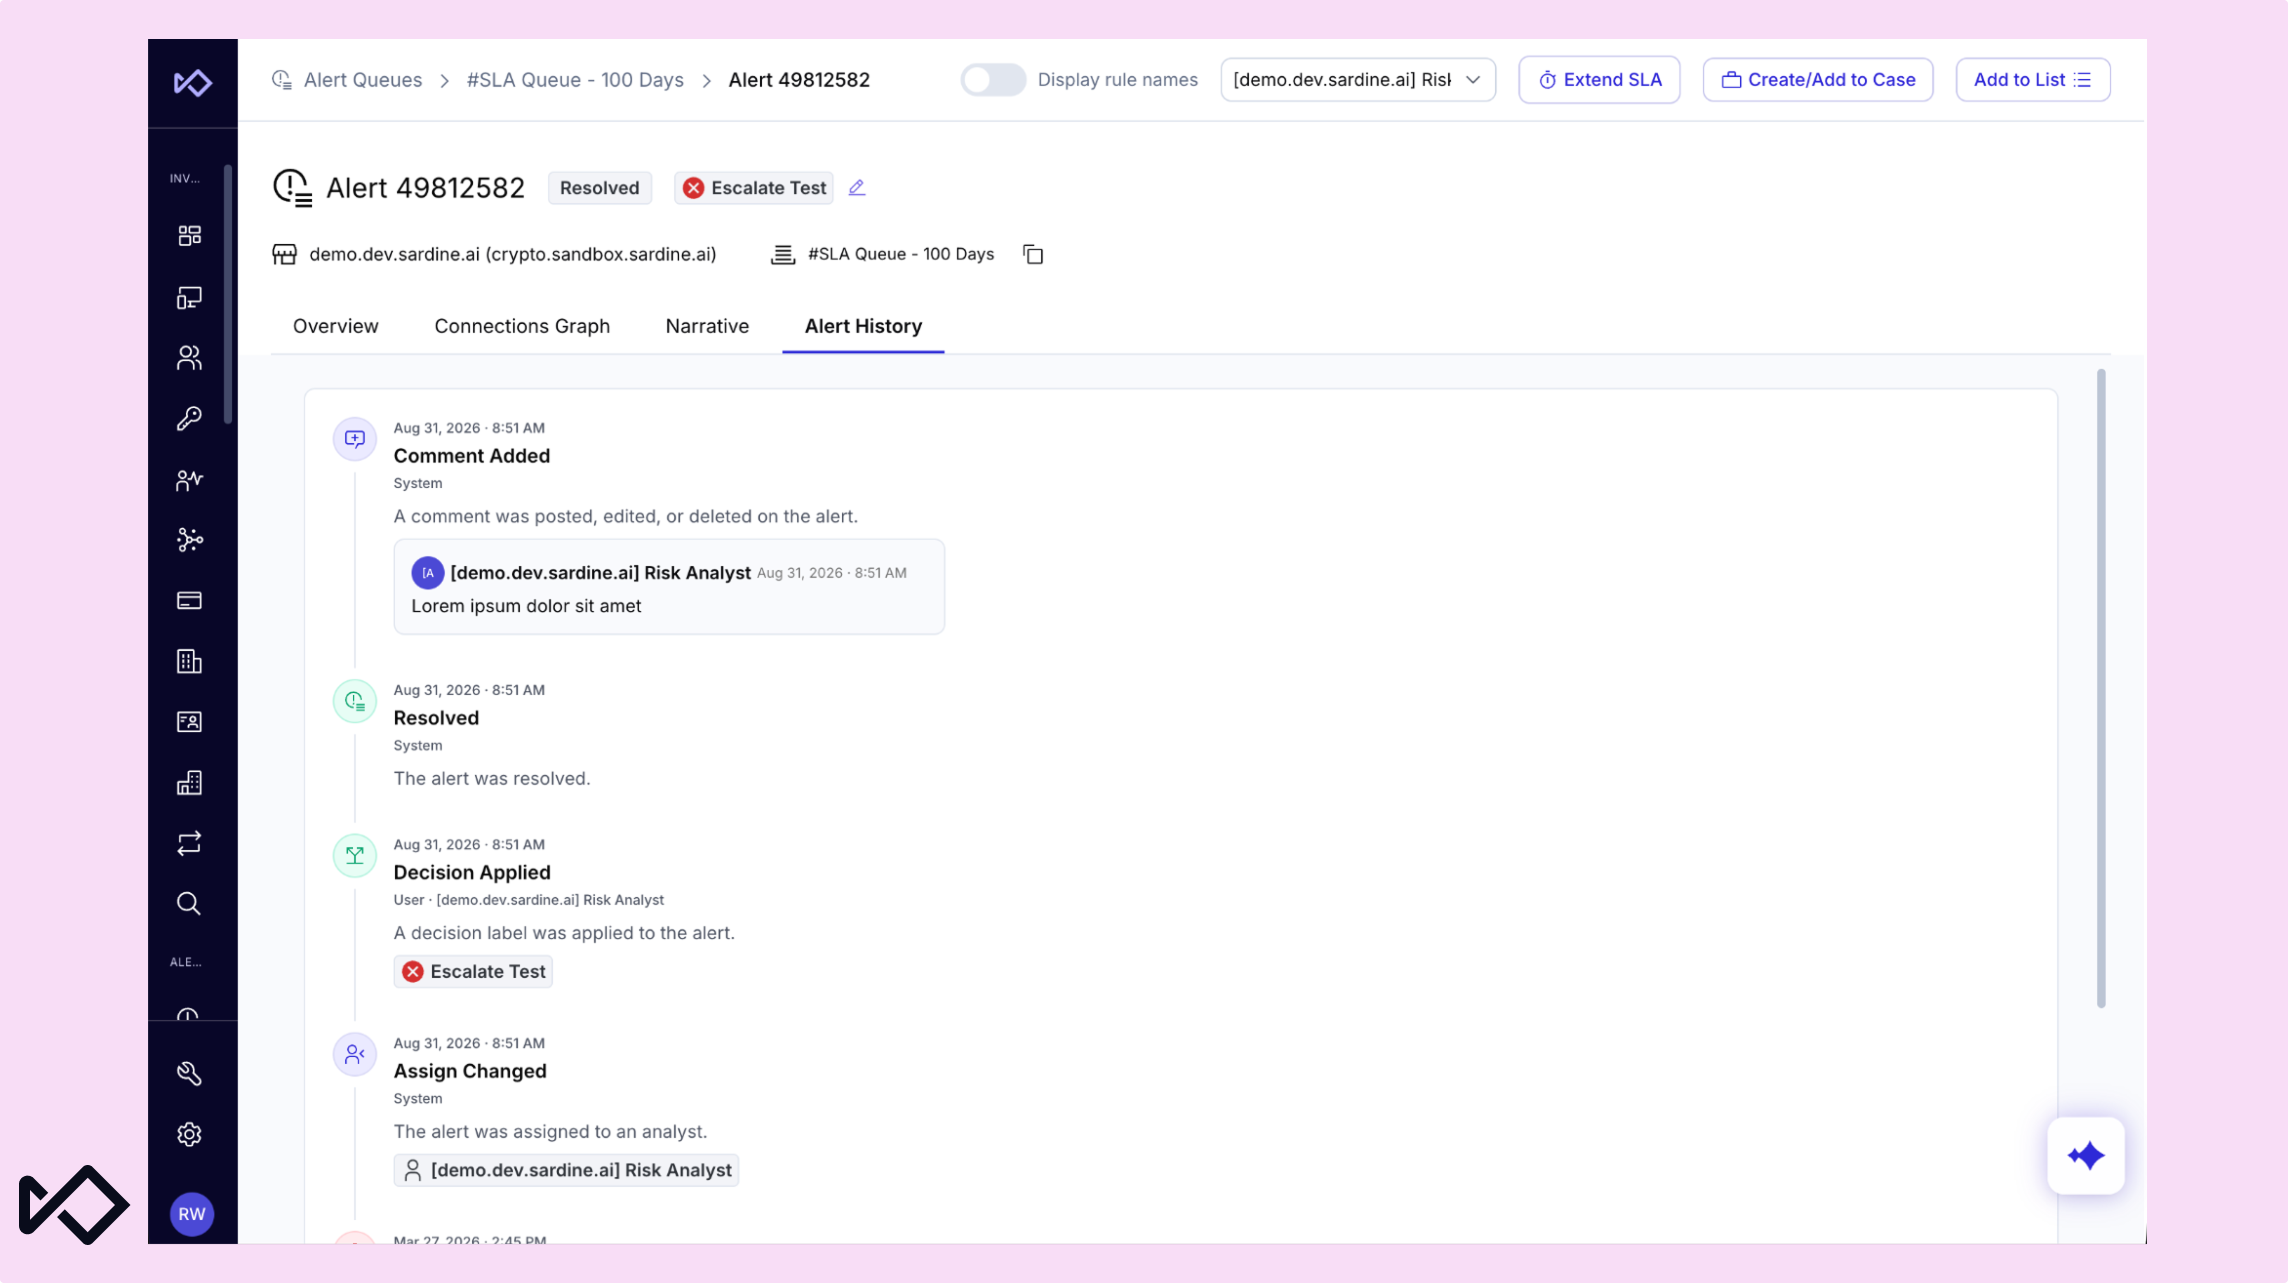
See the full history behind an alert
Alert History captures more of the context behind how an investigation progressed.
Updates to decisions, assignment status, comments, QA reviews, escalations, checklists, attachments, and re-triggers now appear in a unified timeline. Each event shows what changed, who made the update, and when it happened, while system-generated activity receives a separate System label.
The timeline also standardizes event categories, colors, icons, timestamps, titles, and descriptions so longer histories are easier to scan. When specific event fields are unavailable, the history still keeps a readable title rather than dropping the event entirely.
Teammates, QA reviewers, and auditors can follow how an alert changed over time from a single timeline.
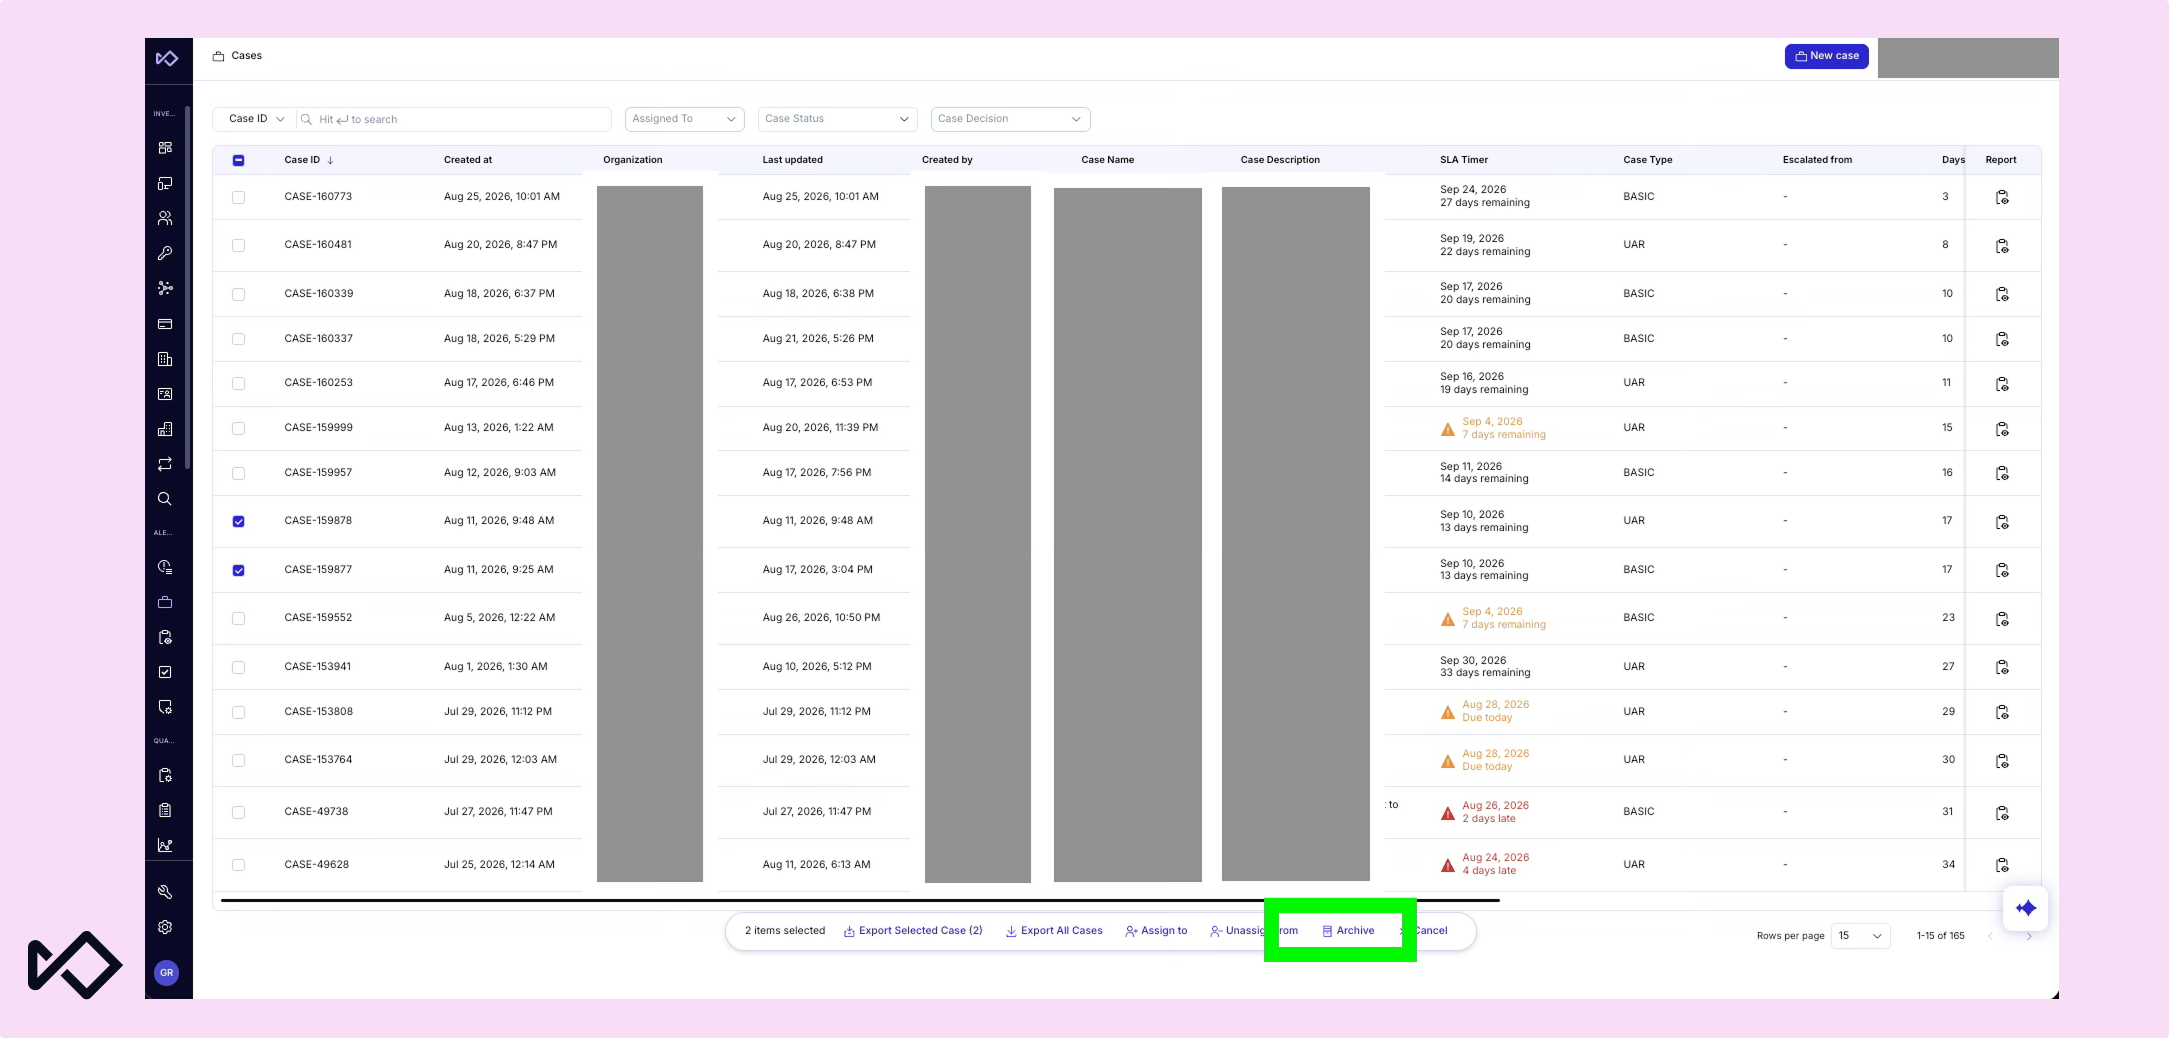
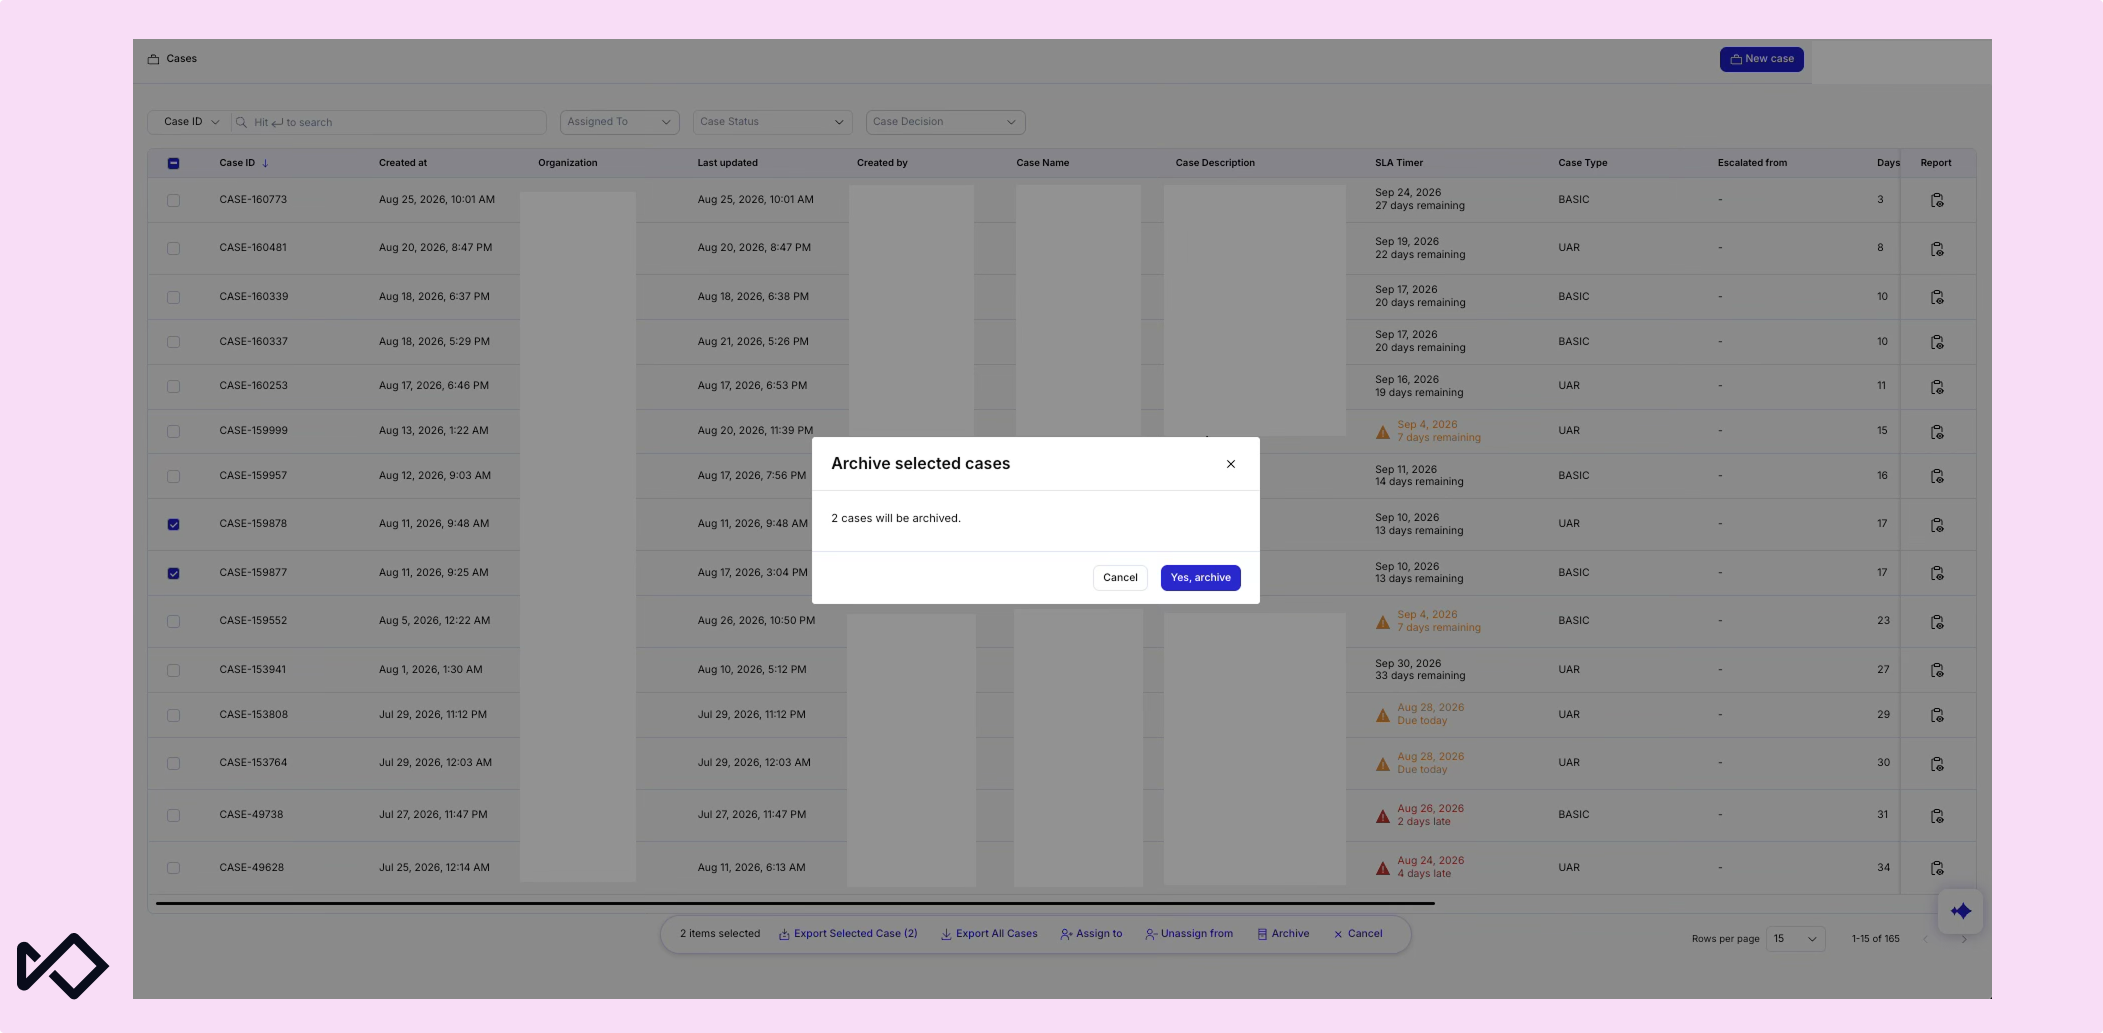
Archive inactive cases without losing context
Inactive cases no longer have to stay in active queues just because the underlying record still matters.
Teams can archive cases and restore them later without closing or deleting the underlying record. Sardine saves the case’s existing status when it’s archived, so restoring it returns the case to the stage where the team left off.
Archived cases are hidden from standard case lists but remain accessible through a direct URL or API request. Cases in open, closed, or report-created states can be archived, while cases in escalation, more-info, or filed states remain protected from archiving.
Active queues stay focused while the underlying case and its status remain available when needed.
Analytics: Bring risk trends into the review
Teams shouldn’t have to recreate the same analysis somewhere else every time they want to understand what’s happening with a business or compare patterns across segments. August brings more of that analysis directly into Sardine.
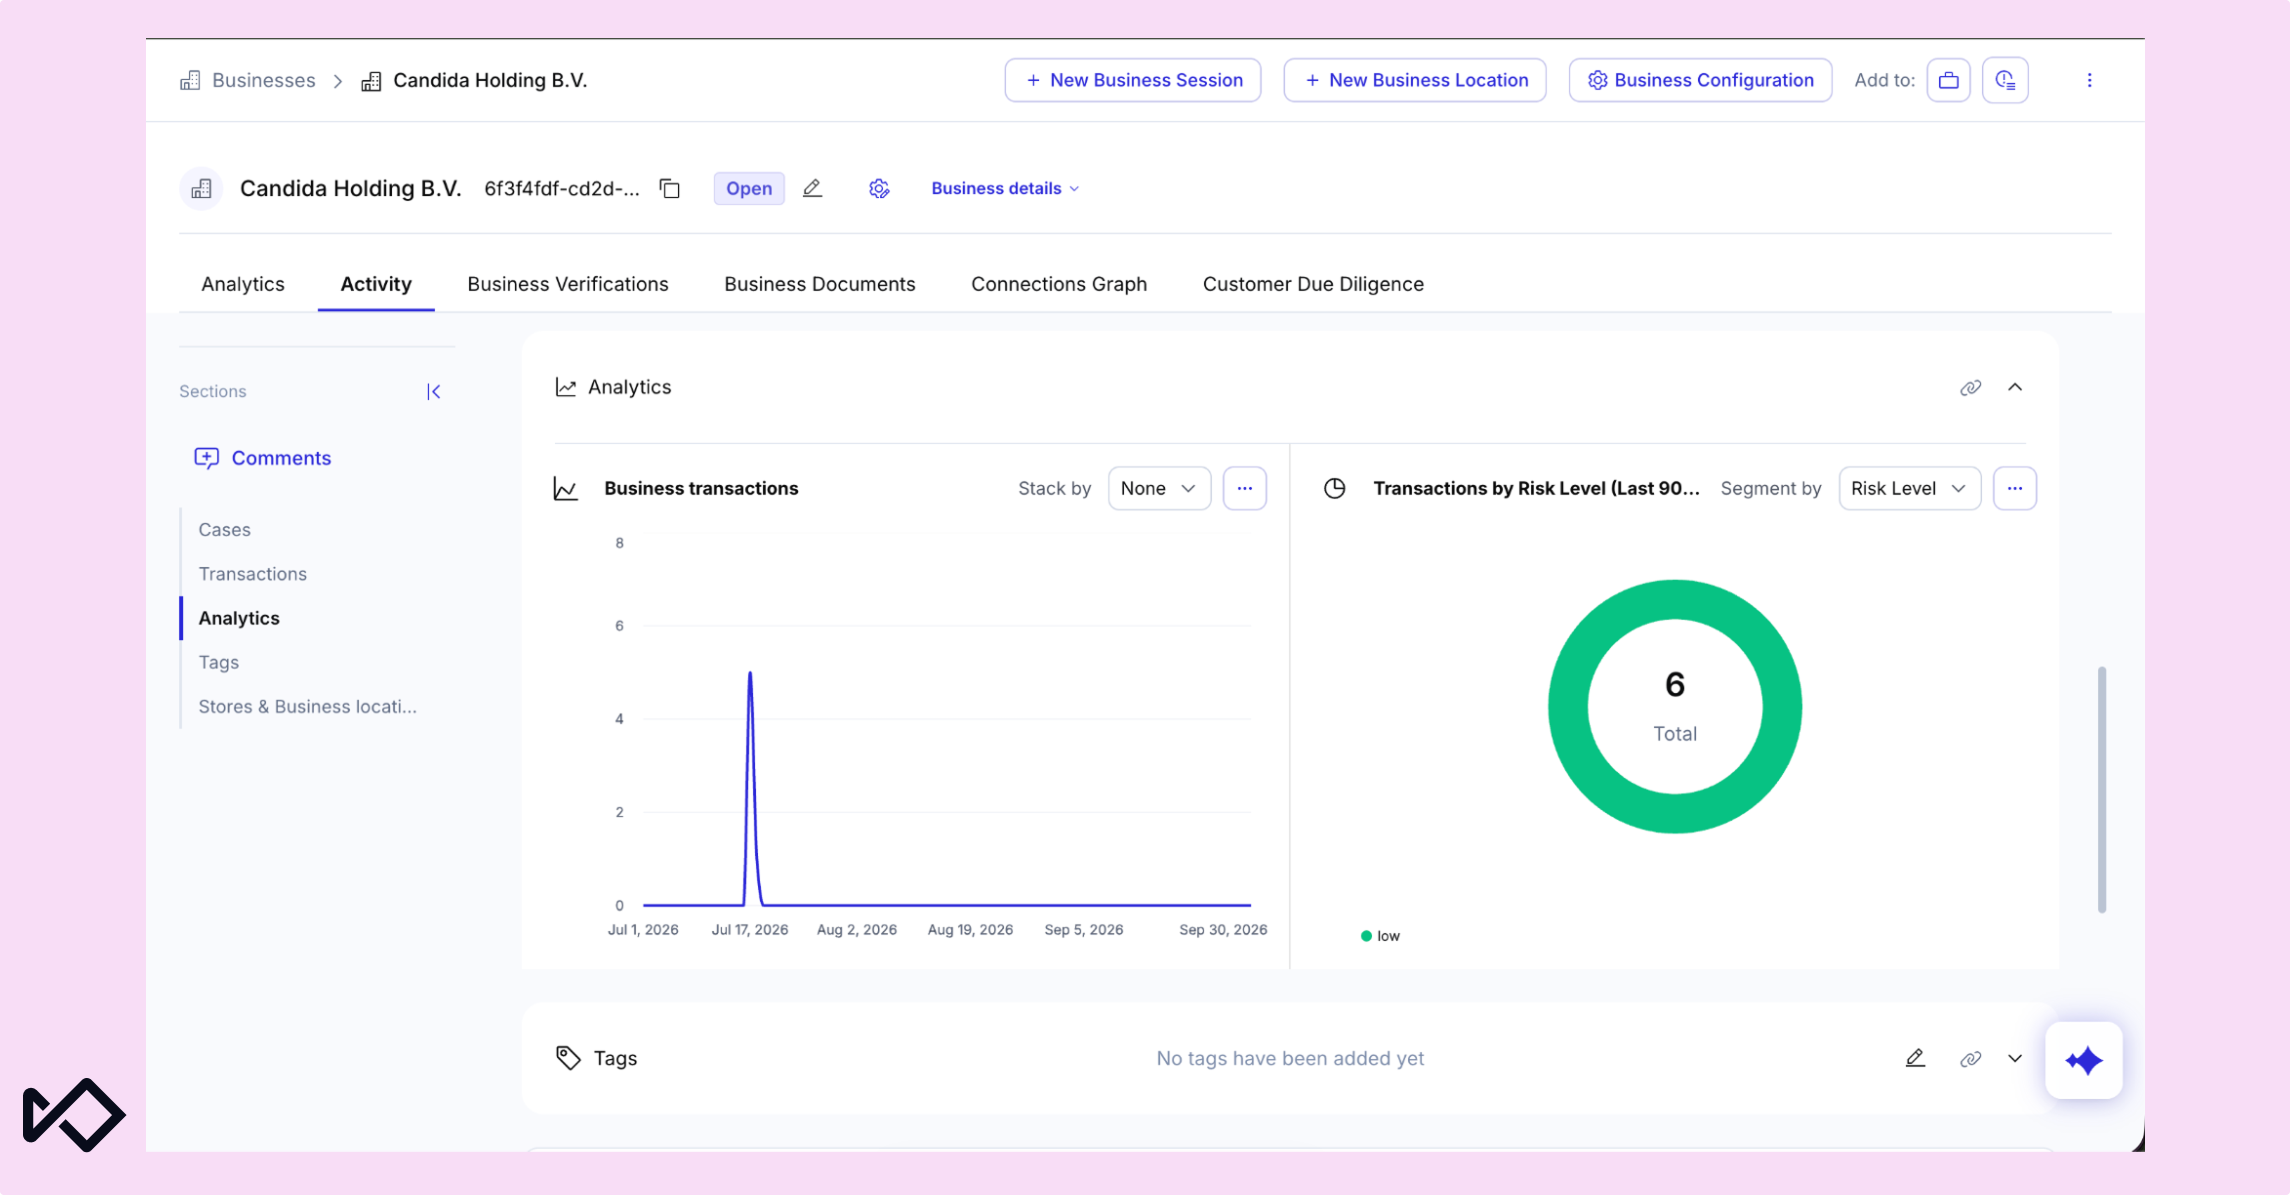
Track risk metrics and transaction trends directly on business profiles
Business profiles now include analytics scoped specifically to the organization under review.
A new Analytics tab shows transaction activity for that business, with the default view displaying transaction volume broken down by risk level over the previous 30 days.
The experience uses the same charting and control patterns already available on customer profiles and only appears to users with the appropriate embedded chart permissions. Behind the scenes, the analytics panel filters queries by business ID so each profile displays data for that organization. Reviewers can see recent transaction activity and risk distribution in the context of the business they are already reviewing.
Compare segments with stacked line and bar charts
Dashboard analytics now offer more ways to compare trends across categories in the same view.
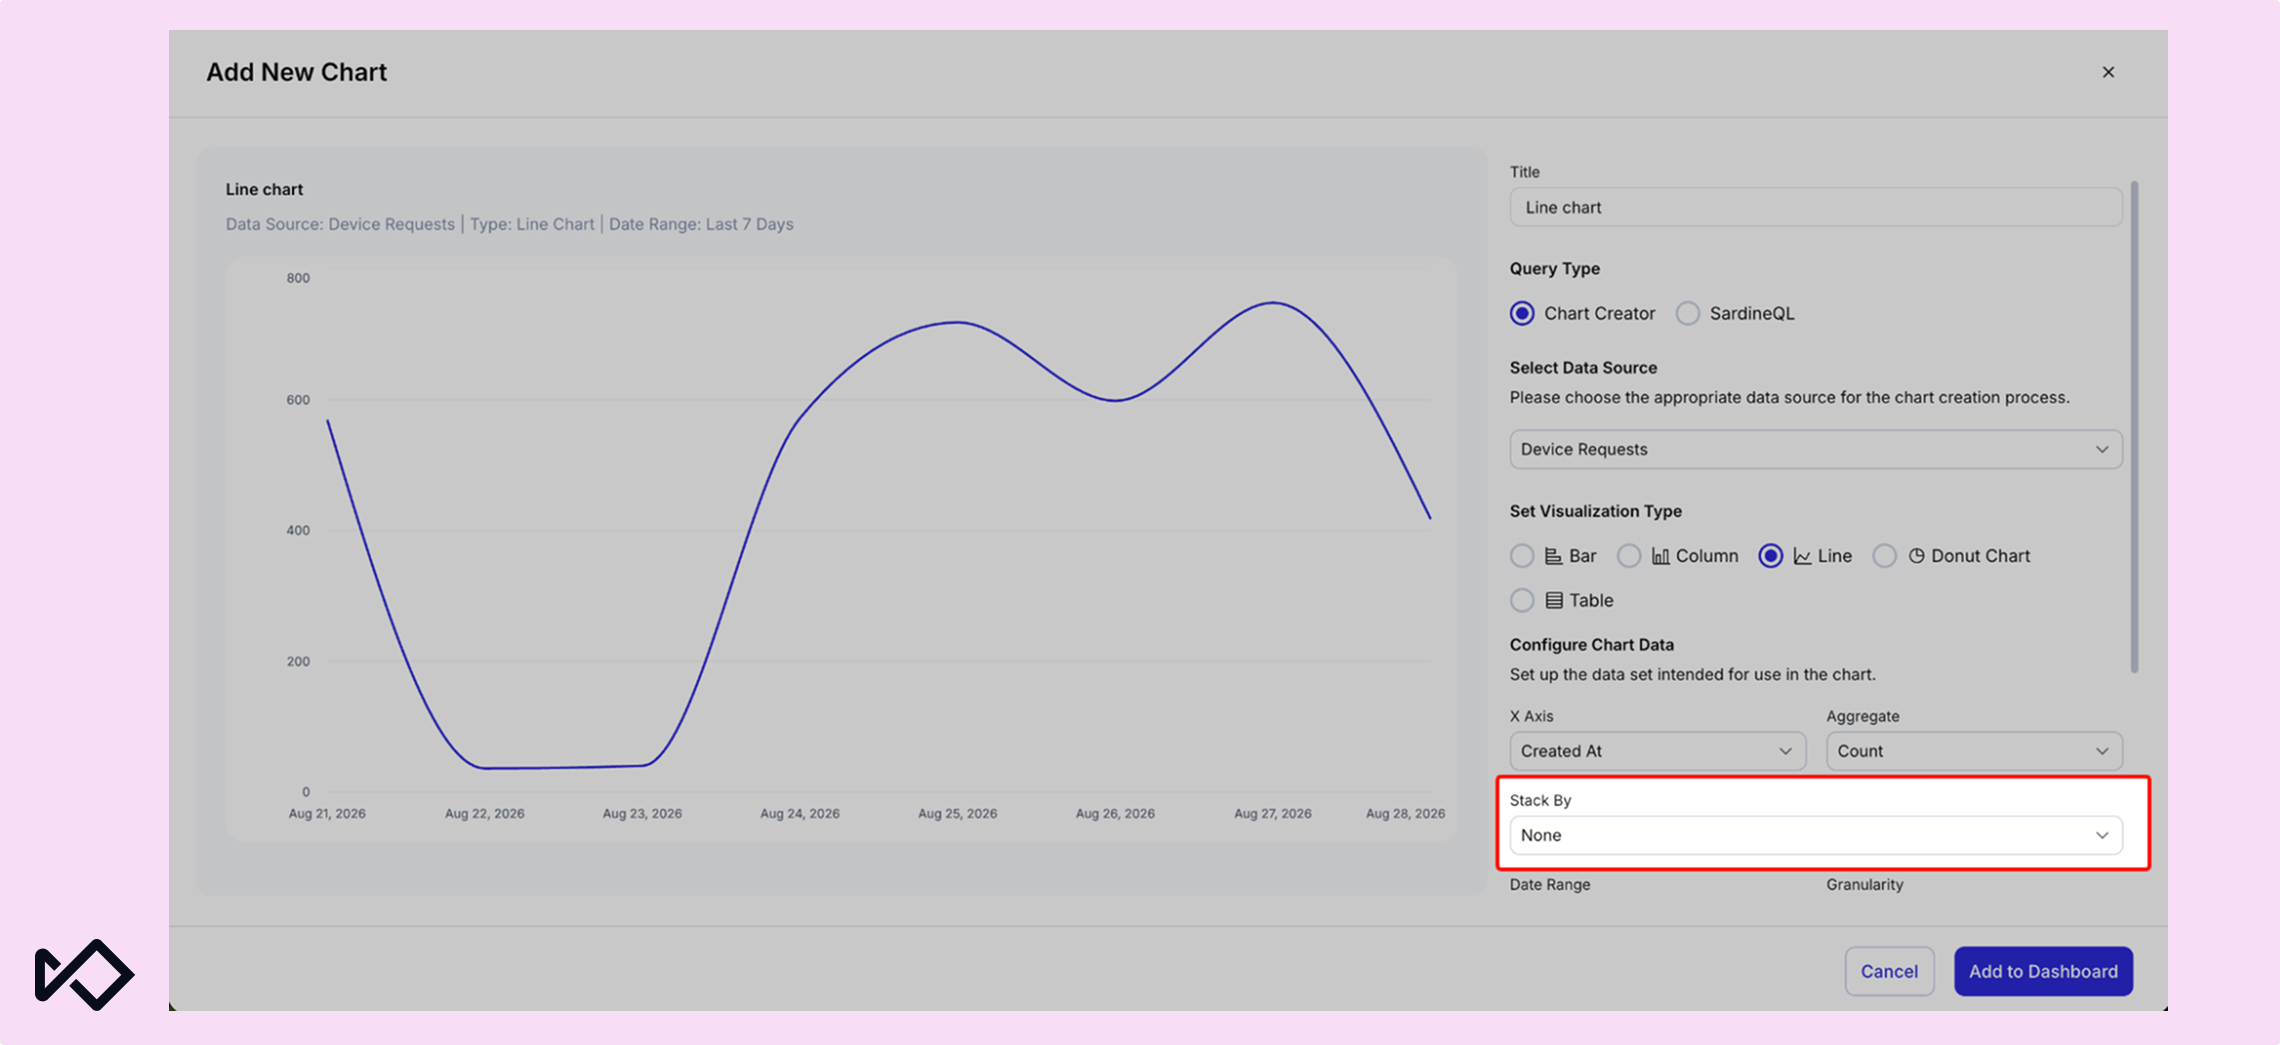
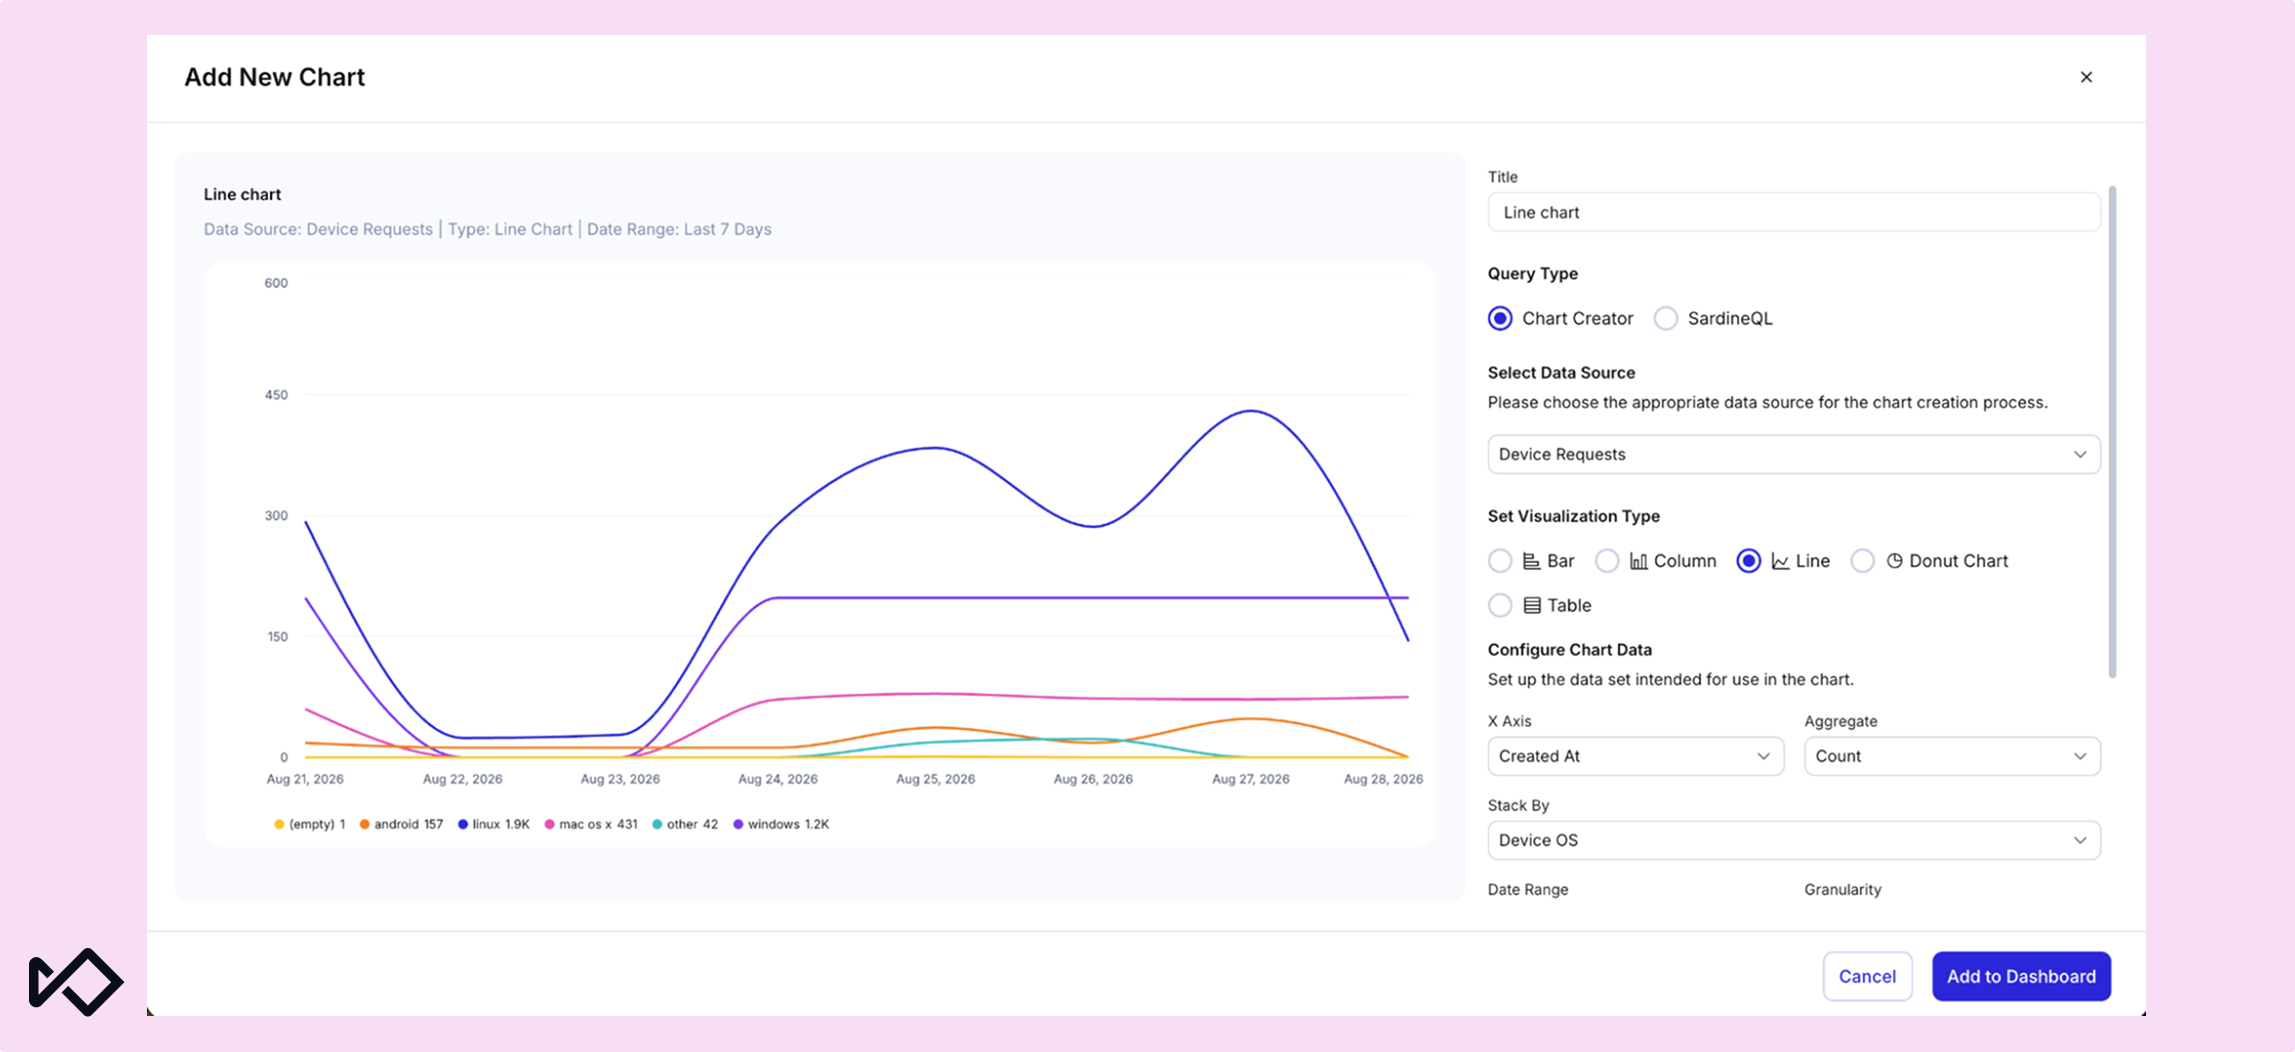
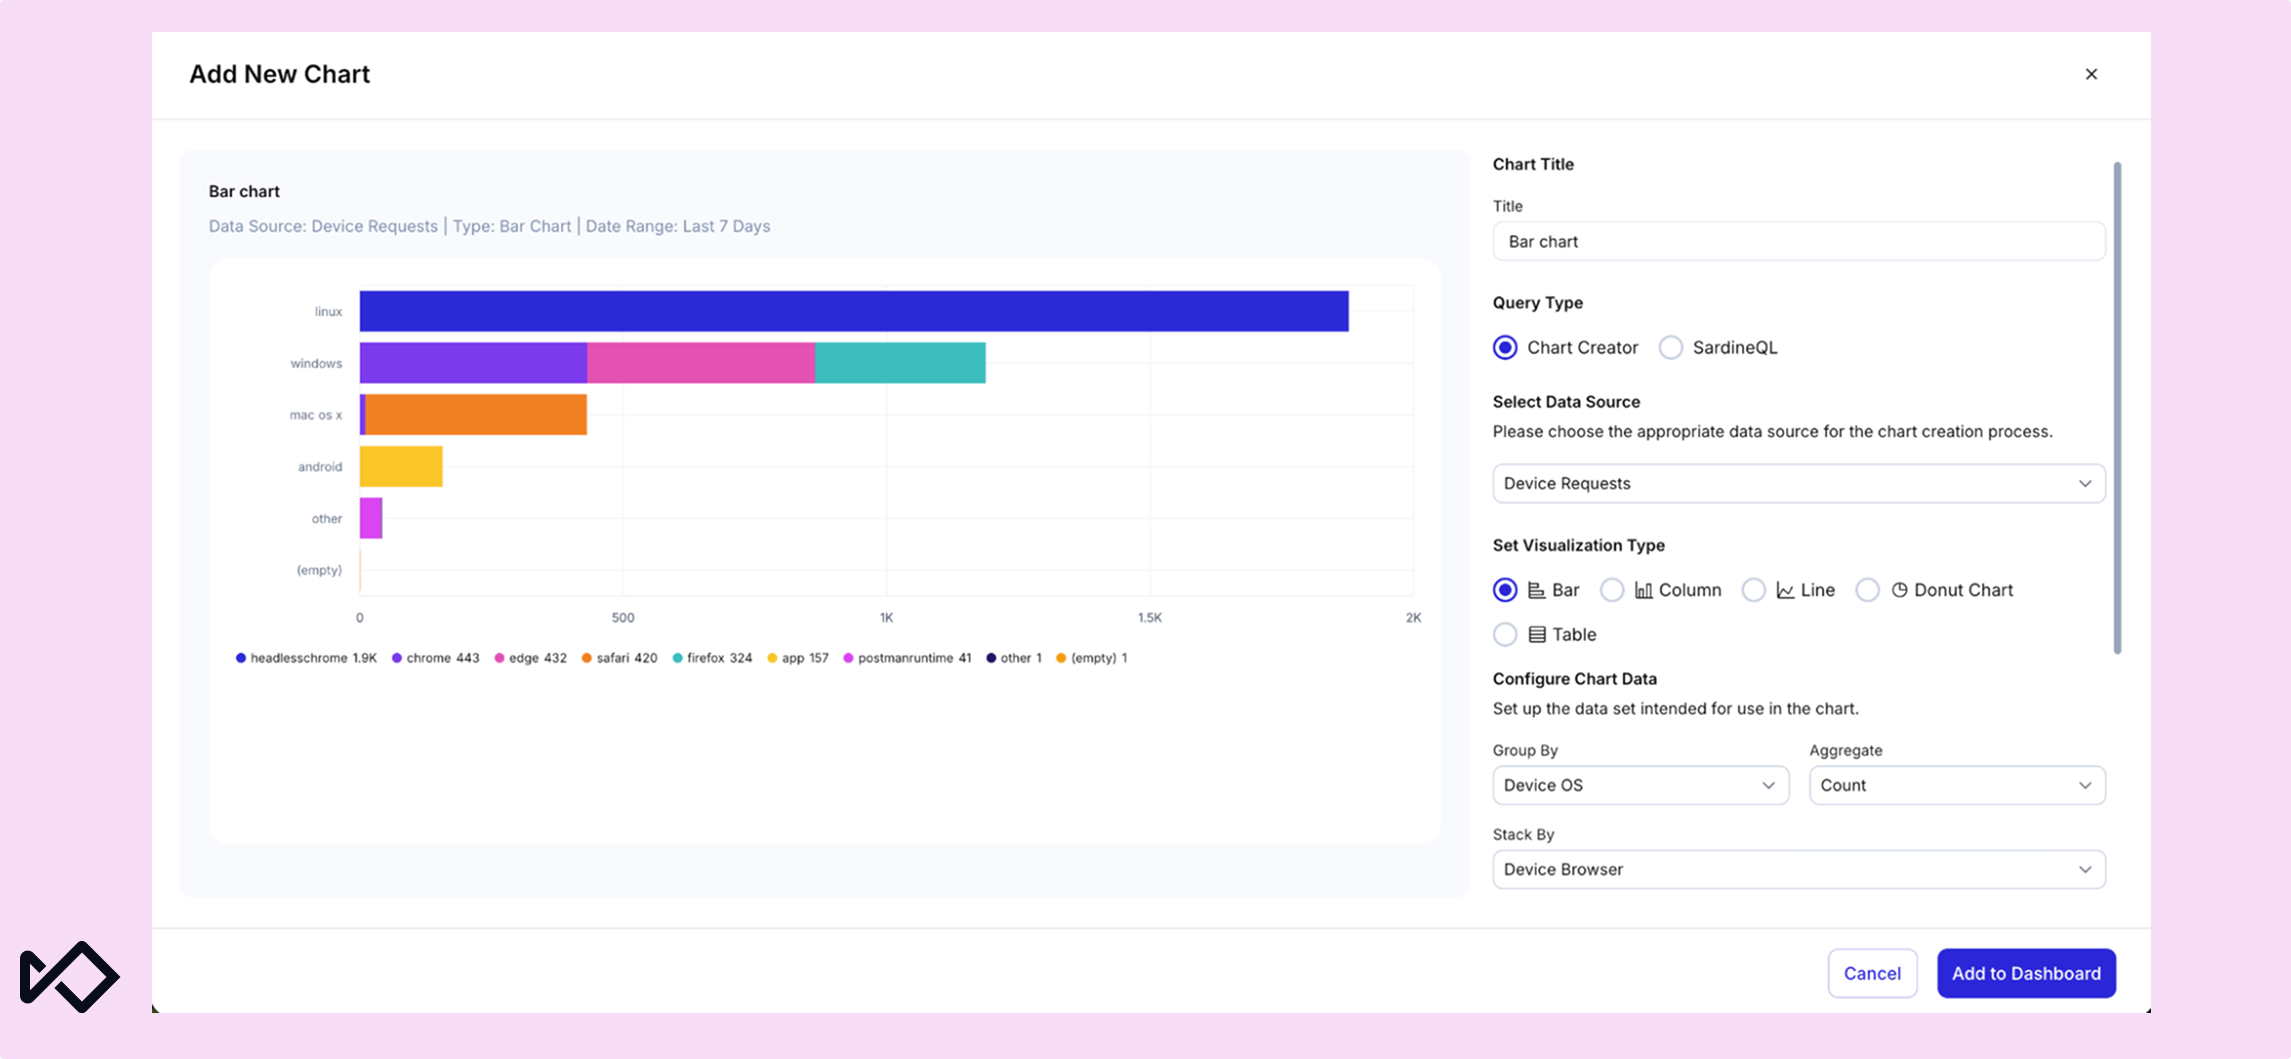
Line charts support a Stack By dimension, allowing teams to plot separate series for values such as payment method, risk level, or another selected field. Teams can limit the number of visible series and group the remaining values into an Other category, while stacking settings remain in place when switching between line, bar, and column views.
Bar charts now support the same second-dimension breakdown, including row search and visibility controls for crowded charts. Stacked chart exports also preserve the displayed stack columns, including labels for empty and Other values.
Teams can compare multiple segments in one analysis and carry the displayed data into offline reporting.
Want to see any of this in action? Get in touch for a demo. Current customers can find the full details, including this month’s SDK updates, in our release notes and changelog.